
AI Overviews Revenue Leak Diagnostic
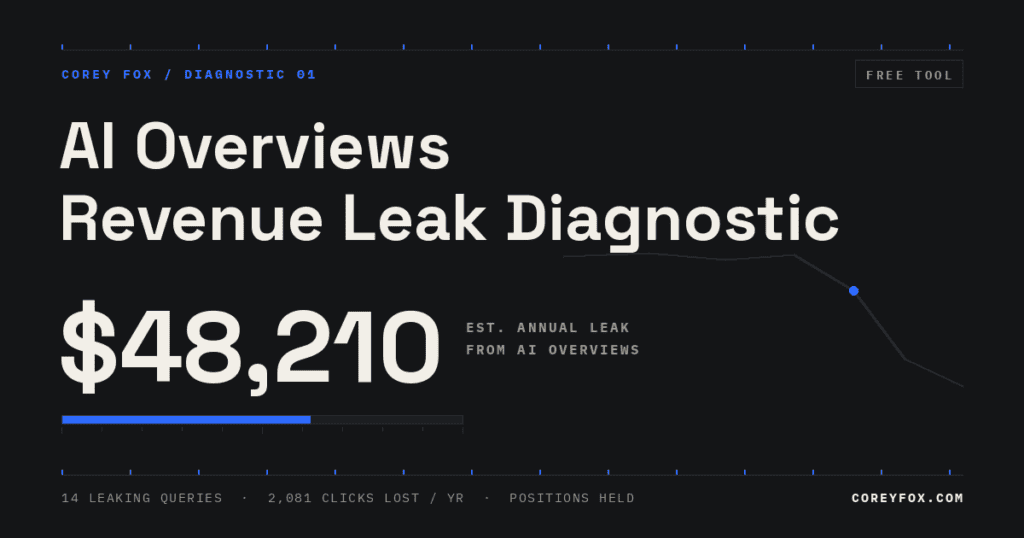
Your rankings held. Your clicks didn’t. This instrument reads your own Search Console data, isolates the queries where AI Overviews are intercepting your traffic, and puts an annual dollar figure on the leak.
No Search Console export handy? Get a 60-second benchmark estimate first. Four inputs, no login, nothing leaves the page.
A benchmark estimate opens the question. Your own data settles it. Run the verified diagnostic below to see the exact queries leaking and what each one costs you.
In Google Search Console: Performance → set the date filter to Compare → Last 3 months vs. Previous period → Export → CSV → upload the Queries file here. Nothing leaves your browser until you choose to save your report.
The AI Overviews Revenue Leak Diagnostic is a free tool that reads your own Google Search Console data, finds the queries where AI Overviews are intercepting your clicks, and estimates what that traffic loss costs you in dollars per year.
It runs entirely in your browser, takes about 60 seconds, and requires no signup to see your topline number.
Unlike questionnaire-based audit tools that score your self-reported answers against generic benchmarks, this diagnostic is measured from your actual search data.
Your numbers, not an estimate of your numbers.
Before optimizing a leaking query, check whether it triggers an AI Overview and which sources Google cites in it.
What is an AI Overviews revenue leak?
An AI Overviews revenue leak is organic traffic lost when Google answers a query directly in an AI-generated summary at the top of the results page.
Your page still ranks, and people still search, but fewer of them click through. The revenue those clicks would have produced is the leak.
The pattern is easy to miss because rank trackers show nothing wrong. Your positions hold. Your impressions hold. Only your click-through rate collapses, and most reporting dashboards do not isolate that specific combination.
AI Overviews now appear in a large share of Google searches, and the majority of searches end without a click to any website, so the leak grows every quarter it goes unmeasured.
How the diagnostic works
The tool scans every query in your Search Console export for the AI Overviews cannibalization signature, which is three conditions occurring together:
| Condition | Threshold | Why it matters |
|---|---|---|
| Position stable | Dropped no more than 1.5 places | Rules out a ranking loss as the cause |
| Demand held | Impressions at 70 percent or more of the prior period | Rules out seasonality and shrinking search volume |
| CTR collapsed | Relative drop of 20 percent or more | The interception itself |
When a query shows all three, something above your listing is absorbing the clicks your position used to earn, and in the current search landscape that something is most often an AI Overview.
The diagnostic also applies a noise floor of 50 impressions per query and only evaluates queries ranking in the top 20, so low-volume noise cannot inflate your number.
One honest caveat: this signature identifies where clicks vanished while rankings held. Featured snippet changes and other SERP feature shifts can produce the same pattern on individual queries. The diagnostic tells you where to look and what it costs.
Confirming which queries trigger an AI Overview against live SERP data is part of the full revenue audit.
How to export your data from Google Search Console
- Open Google Search Console and go to Performance, then Search results
- Click the date filter and choose Compare, then Last 3 months vs. Previous period
- Click Export in the top right and choose CSV
- From the downloaded files, upload the Queries CSV to the tool above
Your data never leaves your browser. The analysis runs locally on your device, and nothing is transmitted unless you choose to save your full report.
How the dollar figure is calculated
For every flagged query, the tool calculates lost clicks as the CTR difference multiplied by current impressions, annualizes that figure based on your export period, then converts clicks to revenue using your conversion rate and average order value:
Annual leak = (CTR before minus CTR now) x current impressions x annualization x conversion rate x average order value
Worked example: a query holding position 3.2 with 28,400 quarterly impressions drops from 3.28 percent CTR to 1.45 percent. That is roughly 520 lost clicks per quarter, or 2,080 per year. At a 2 percent conversion rate and a $150 average order, that single query leaks about $6,200 per year. Most sites we diagnose have ten or more queries in this condition.
What the quick estimate assumes
The no-upload estimate uses industry benchmarks for how often AI Overviews appear across a vertical’s query mix, combined with an observed click erosion band of 15 to 35 percent on affected queries:
| Industry | Estimated AI Overview exposure |
|---|---|
| Media, content, education | 55 percent |
| Health and medical | 50 percent |
| B2B SaaS and software | 45 percent |
| Finance and insurance | 40 percent |
| E-commerce and retail | 30 percent |
| Local and home services | 25 percent |
Informational-heavy verticals see higher exposure because AI Overviews trigger most often on question-style and definition-style queries. The estimate exists to size the problem in 60 seconds. The verified diagnostic exists to prove it with your own data.
How to recover traffic lost to AI Overviews
You do not recover this traffic by ranking harder. You recover it by becoming the source the AI Overview cites, which puts your brand inside the answer instead of below it. The core moves:
- Lead with a direct answer. Place a 40 to 60 word answer to the query immediately after the page’s main heading. AI systems extract and cite content that answers cleanly.
- Restructure for extraction. Convert buried prose into tables, numbered steps, and definition-style sections that map to the questions people ask.
- Fix your structured data. Accurate, non-conflicting schema markup makes your entities and claims machine-readable. Competing schema systems on one page actively hurt.
- Add citation-worthy data. Original numbers, named methods, and specific claims get cited. Generic advice does not.
- Build entity clarity. Define who you are, what you do, and what each page covers so language models associate your brand with the topic.
This is Answer Engine Optimization, and it is the entire premise of my practice. If your diagnostic shows a five-figure annual leak, book the free revenue audit and I will walk your report with you query by query, or review the AEO service tiers to see what recovery looks like as an ongoing system.
Frequently asked questions
Is the AI Overviews Revenue Leak Diagnostic really free?
Yes. The topline leak number, the benchmark estimate, and the summary stats are free with no signup. Entering your email unlocks the full query-level table and an AI-generated recovery plan. There is no paid version of the tool.
Is my Search Console data safe?
Yes. The CSV is parsed and analyzed inside your browser. No search data is uploaded to any server. The only information transmitted is your email address and topline result, and only if you choose to unlock the full report.
Why does the tool need a Compare export instead of a normal one?
Detecting a leak requires before-and-after data for the same queries. A standard export shows one period only, which cannot distinguish an AI Overviews interception from a page that never earned clicks. The Compare export gives both periods in one file.
My rankings are fine but traffic is down. Is that AI Overviews?
Possibly, and that is exactly the pattern this tool tests for. Stable positions with stable impressions and falling CTR is the AI Overviews signature. If the diagnostic finds no flagged queries, the cause is more likely seasonality, indexing, or a lost SERP feature.
Can AI Overviews traffic loss be recovered?
Not by traditional ranking tactics alone. Recovery means becoming a cited source inside the AI answer through direct answer formatting, clean structured data, entity clarity, and citation-worthy content. Brands cited in the answer also gain visibility even from searches that never produce a click.
How accurate is the dollar figure?
It is an estimate built from your real click data and your own conversion rate and order value inputs. It is directionally reliable for prioritization and conservative by design. Treat it as the floor of the problem, not an exact invoice.