Organic vs Paid Search Statistics (2026): 60+ Data Points
Last Updated on October 27, 2026 by Corey Fox
I pulled together the most current, verifiable data on how organic and paid search compare in 2026: who gets the traffic, who gets the clicks, what each click costs, and how AI answers are changing both. Every number below links to the page where I found it, and older figures are labeled with their year.
Key statistics
- 58%: drop in position-1 organic CTR when a Google AI Overview appears (Ahrefs, 2026)
- 19.7% to 6.34%: paid CTR on queries with AI Overviews, June 2024 to September 2025 (Seer Interactive, 2025)
- 8% vs 15%: share of Google visits where users clicked a traditional result with vs without an AI summary (Pew Research Center, 2025)
- 58.5%: of US Google searches ended with zero clicks (SparkToro/Datos, 2024)
- $5.26: average Google Ads CPC, up 12.88% year over year, with 87% of industries seeing increases (WordStream, 2025)
- 22% vs 21%: share of US ecommerce sessions from paid search vs organic search (Grips Intelligence, Oct 2025 to Apr 2026)
- 9%: year-over-year decline in organic traffic across 6,500+ sites, while cost per visit rose 9% (Contentsquare, 2026)
- 22.6% vs 3.6%: position-1 organic CTR without vs with an AI answer on the page (First Page Sage, 2026)
- 89.94%: Google’s worldwide search engine market share in September 2026 (StatCounter, 2026)
- About 1.1 billion: people blocking ads worldwide, roughly 30% of internet users (eyeo, 2026)
Share of website traffic: organic vs paid search
Channel mix depends heavily on who is measuring and which sites are in the sample, so treat these as directional.
- 53% of all trackable website traffic came from organic search in BrightEdge’s channel research, up from 51% in 2014 (BrightEdge, 2019)
- 68% of trackable website traffic came from organic and paid search combined (BrightEdge, 2019)
- 5% of trackable traffic came from organic social, flat since 2014 (BrightEdge, 2019)
- 39% of all digital traffic was paid in 2024, up from 37% in 2023, across 90 billion sessions on 6,000 websites (Contentsquare, 2025)
- 9% year-over-year decline in organic search traffic, Q4 2024 to Q4 2025, across 6,500+ websites and 99 billion visits (Contentsquare, 2026)
- Less than 1% of referral traffic came from AI search between January and August 2025, with organic search still the primary driver (BrightEdge, 2025)
- 88%: AI agent requests reached 88% of human organic search activity on the sites BrightEdge tracks (BrightEdge, 2026)
Ecommerce: organic vs paid traffic, conversion and order value
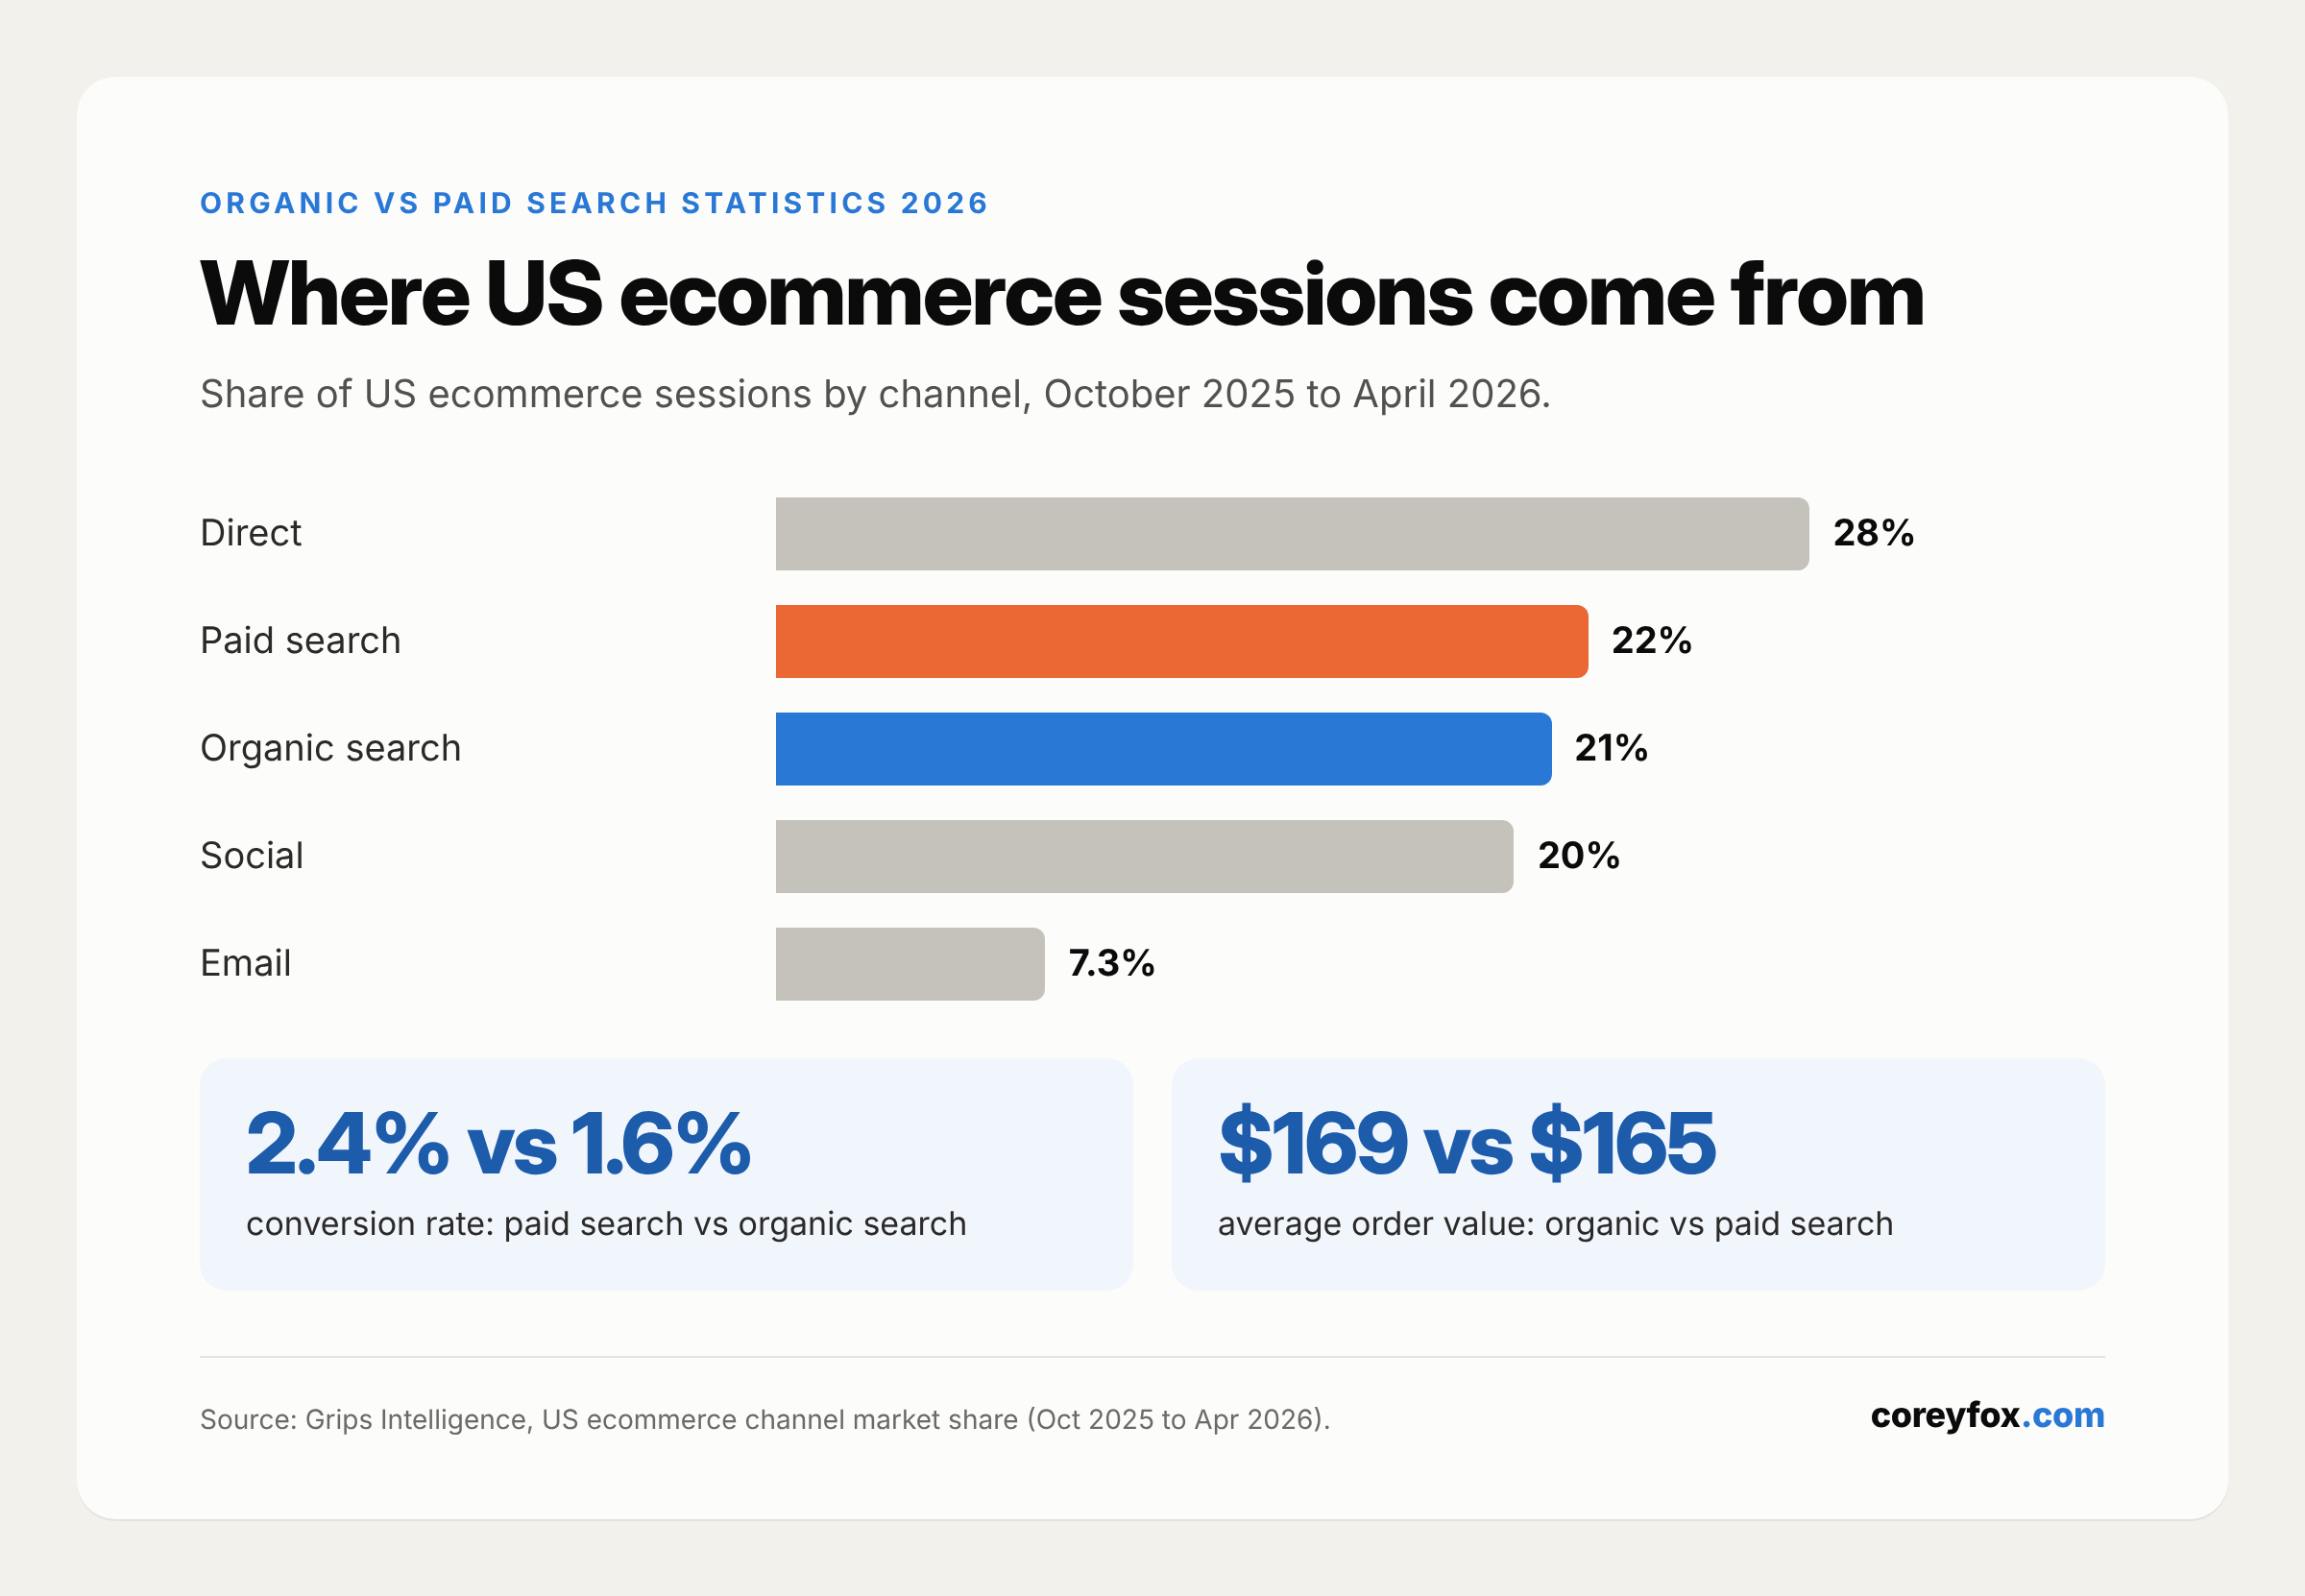
Grips Intelligence tracks US ecommerce sites by channel. Paid and organic search bring in nearly the same share of sessions.
- 22% of US ecommerce sessions came from paid search (Grips Intelligence, Oct 2025 to Apr 2026)
- 21% of US ecommerce sessions came from organic search (Grips Intelligence, Oct 2025 to Apr 2026)
- 28% came from direct, 20% from social, and 7.3% from email (Grips Intelligence, Oct 2025 to Apr 2026)
- 2.4% vs 1.6%: conversion rate of paid search vs organic search traffic on US ecommerce sites (Grips Intelligence, Oct 2025 to Apr 2026)
- $169 vs $165: average order value from organic search vs paid search (Grips Intelligence, Oct 2025 to Apr 2026)
- 9% year-over-year increase in the cost of an online visit, and 19% over two years (Contentsquare, 2025)
- 9% further rise in cost per visit, alongside a 9% drop in conversion rate (Contentsquare, 2026)
Organic CTR by ranking position
Studies disagree on absolute numbers because they use different data (Search Console vs clickstream) and different query sets. All agree position 1 takes a large share and clicks fall off quickly.
- 7.1% blended CTR for the position-1 organic result, 3.0% for position 2 and 1.7% for position 3 (First Page Sage, 2026)
- 22.6% position-1 CTR when no AI answer is present, vs 3.6% when one is (First Page Sage, 2026)
- 11.4% CTR for featured snippets, which appeared on 6.8% of queries (First Page Sage, 2026)
- 2.1% CTR for the top paid ad, falling to 1.4% in ad position 2 (First Page Sage, 2026)
- 27.6% average CTR for the number one organic result in a 4 million result analysis (Backlinko, 2019 study, updated 2025)
- 54.4% of all clicks went to the top three organic results (Backlinko, 2019 study, updated 2025)
- 0.63% of searchers clicked something on page 2 (Backlinko, 2019 study, updated 2025)
- 10x: position 1 is about 10 times more likely to be clicked than position 10 (Backlinko, 2019 study, updated 2025)
- +10.54 percentage points: combined desktop CTR gain for positions 1 to 5 in Q1 2026, while mobile position 1 lost 2.20 points (Advanced Web Ranking, 2026)
How AI Overviews affect organic and paid CTR
The most useful finding here for ad buyers: AI Overviews are not only an SEO problem. Paid CTR dropped too.
- 58% lower CTR for the position-1 result on keywords with an AI Overview, December 2023 vs December 2025, across 300,000 keywords (Ahrefs, 2026)
- 7.3% to 1.6%: position-1 CTR on AI Overview keywords, December 2023 to December 2025 (Ahrefs, 2026)
- 34.5%: the CTR reduction Ahrefs measured in its earlier April 2025 study, before the effect deepened (Ahrefs, 2026)
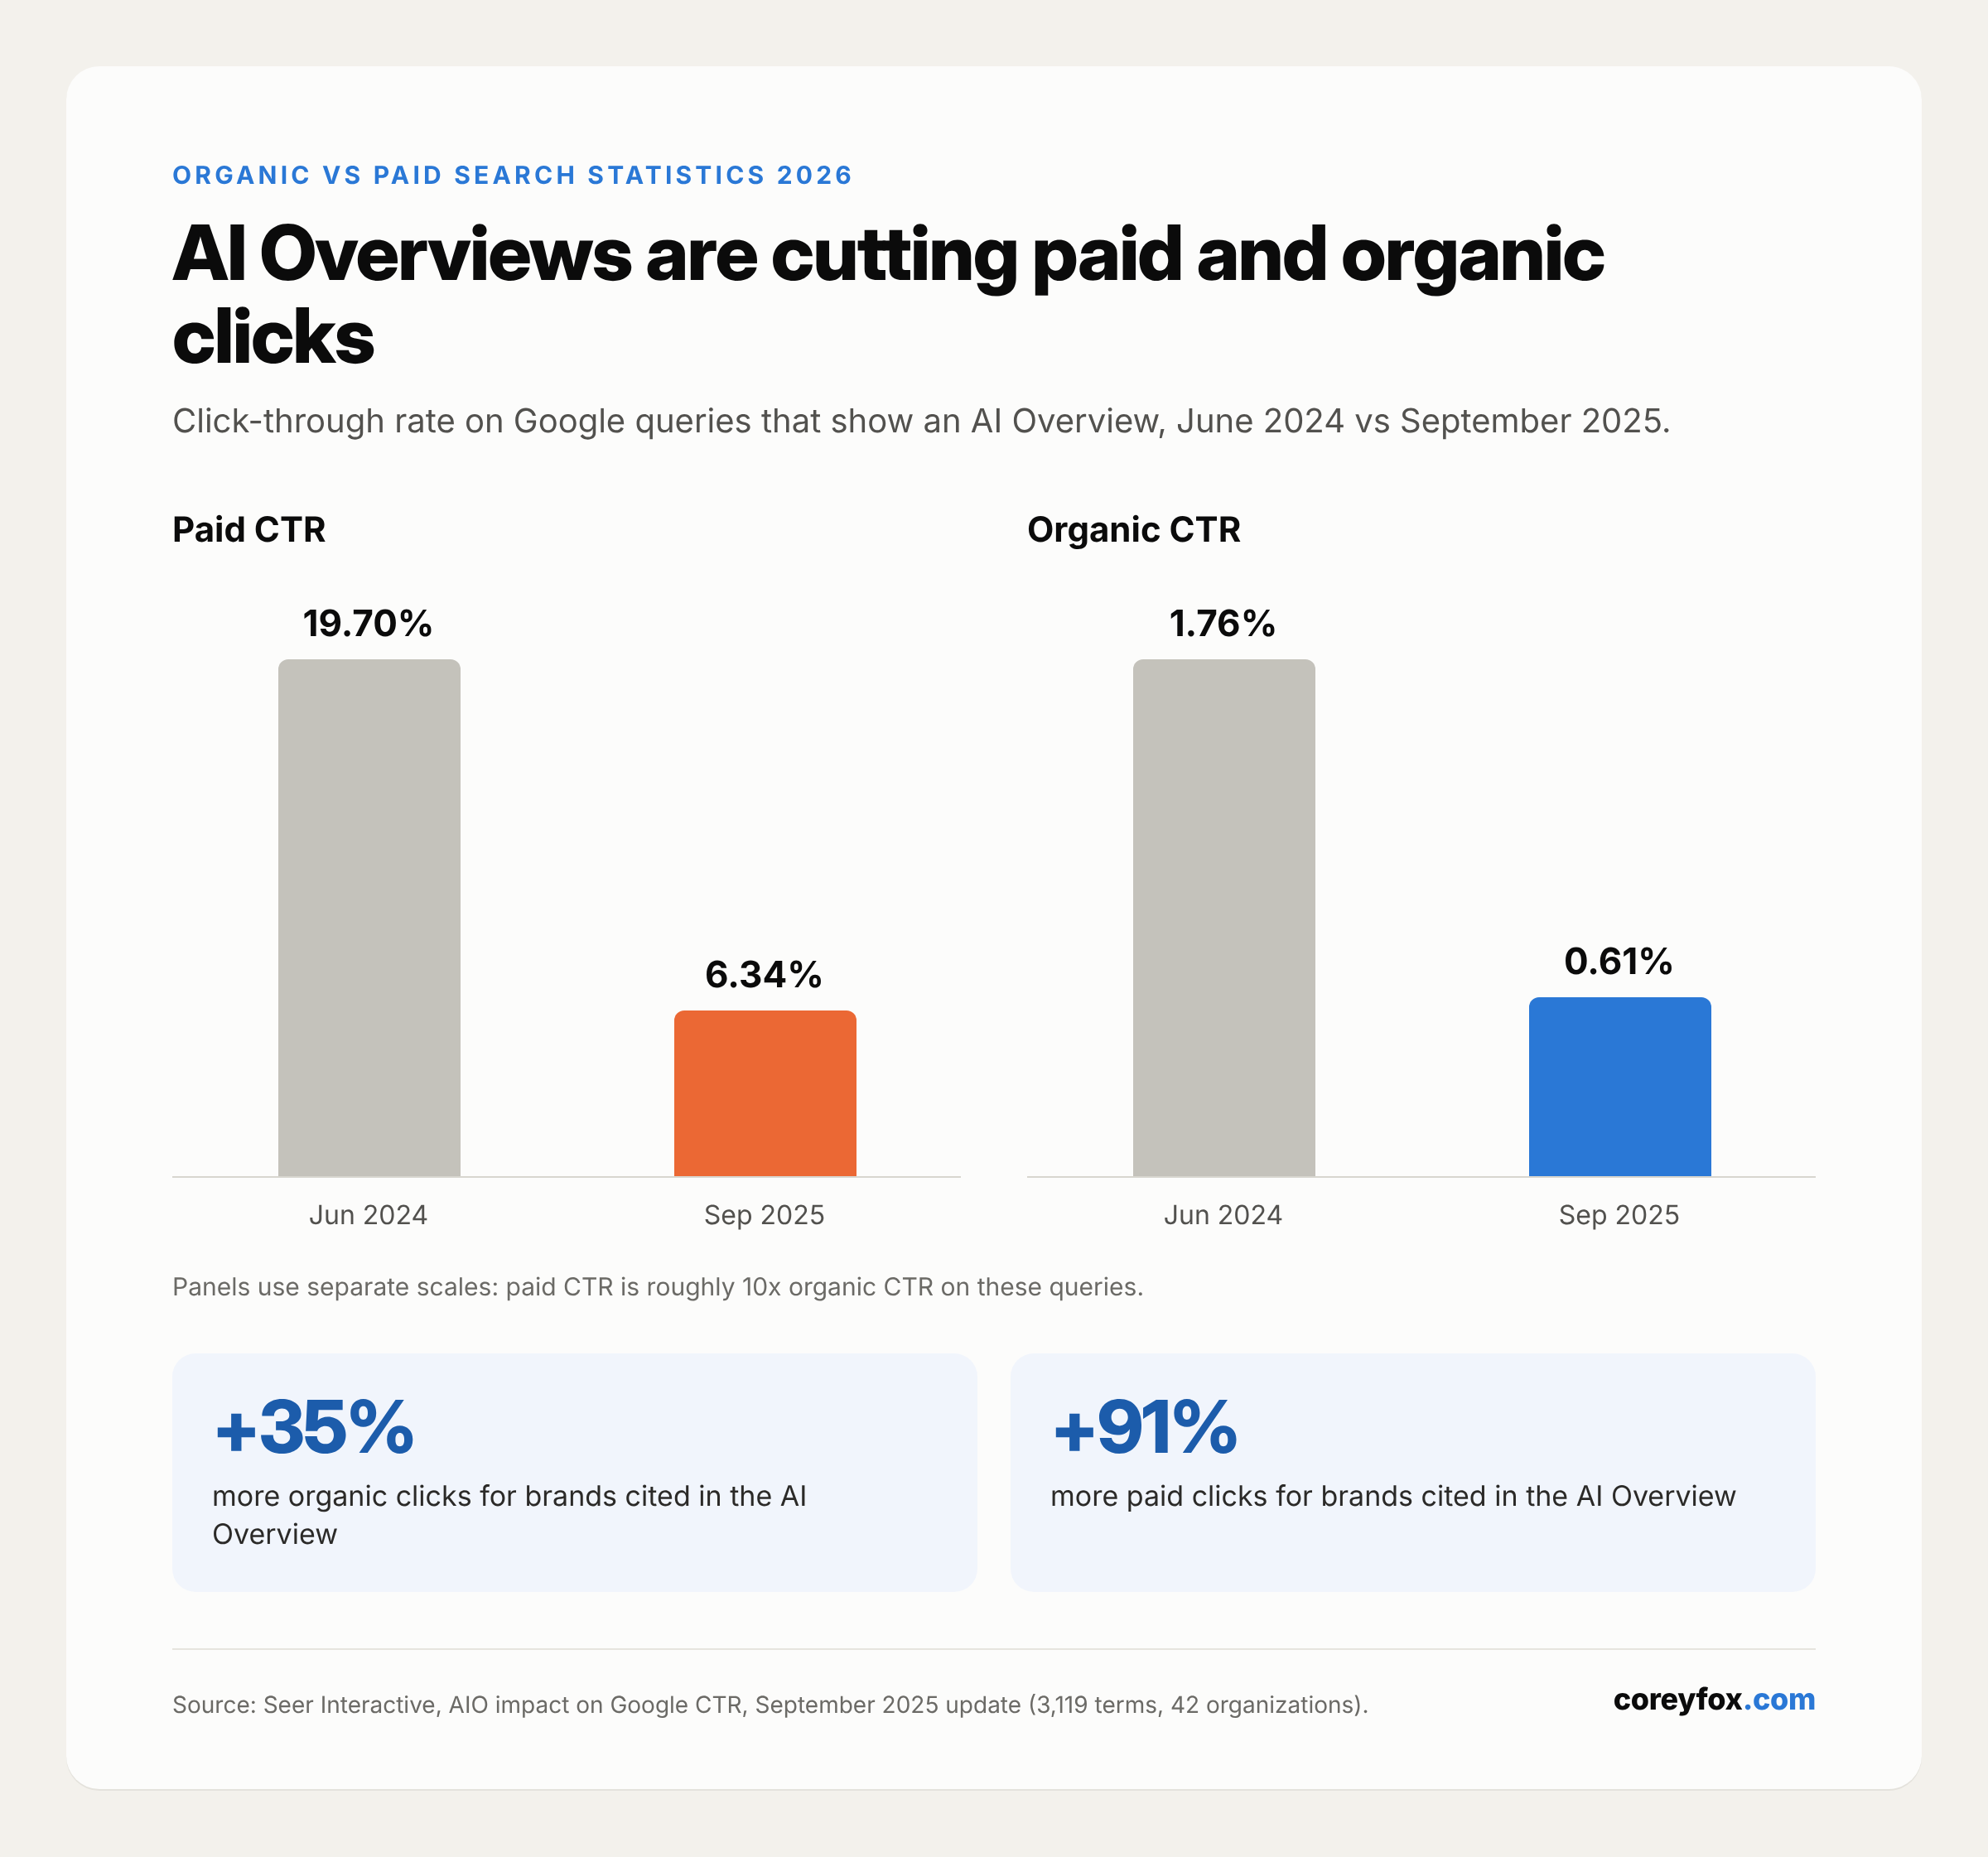
- 1.76% to 0.61%: organic CTR on queries with AI Overviews, June 2024 to September 2025, across 3,119 terms and 42 organizations (Seer Interactive, 2025)
- 41% decline in organic CTR even on queries without an AI Overview, from 2.72% to 1.62% (Seer Interactive, 2025)
- 19.70% to 6.34%: paid CTR on queries with AI Overviews over the same period, a 68% decline (Seer Interactive, 2025)
- 13.88% vs 4.14%: Q3 2025 paid CTR on queries with no AI Overview vs queries where an AI Overview appeared and the brand was not cited (Seer Interactive, 2025)
- 35% more organic clicks and 91% more paid clicks for brands cited inside the AI Overview vs brands not cited (Seer Interactive, 2025)
- 8% of Google visits with an AI summary led to a click on a traditional result, vs 15% without one (Pew Research Center, 2025)
- 1% of visits with an AI summary included a click on a link inside the summary (Pew Research Center, 2025)
- 26% vs 16%: share of users who ended their browsing session after a page with vs without an AI summary (Pew Research Center, 2025)
- 18% of Google searches by Pew’s 900-adult panel produced an AI summary in March 2025 (Pew Research Center, 2025)
- 49% more Google search impressions and nearly 30% lower click-through in the first year of AI Overviews (BrightEdge, 2025)
- 71% average growth in commercial-intent SERPs showing an AI Overview, November 2025 to April 2026, across 600,000+ keywords (Semrush, 2026)
- About 2x: ads now appear alongside AI Overviews roughly twice as often as a year earlier (Semrush, 2026)
Zero-click searches
- 58.5% of US Google searches and 59.7% of EU searches ended without a click (SparkToro/Datos, 2024)
- 360 of every 1,000 US Google searches led to a click on the open web (a non-Google, non-advertiser site). In the EU it was 374 (SparkToro/Datos, 2024)
- Almost 30% of US Google clicks went to Google-owned properties (SparkToro/Datos, 2024)
- 56% to 69%: share of Google searches ending without a click, May 2024 to May 2025, per Similarweb data (Search Engine Roundtable, 2025)
- 26% drop in organic traffic to news sites since Google launched AI Overviews (Similarweb, 2025)
Google Ads CPC, conversion rate and CPC inflation
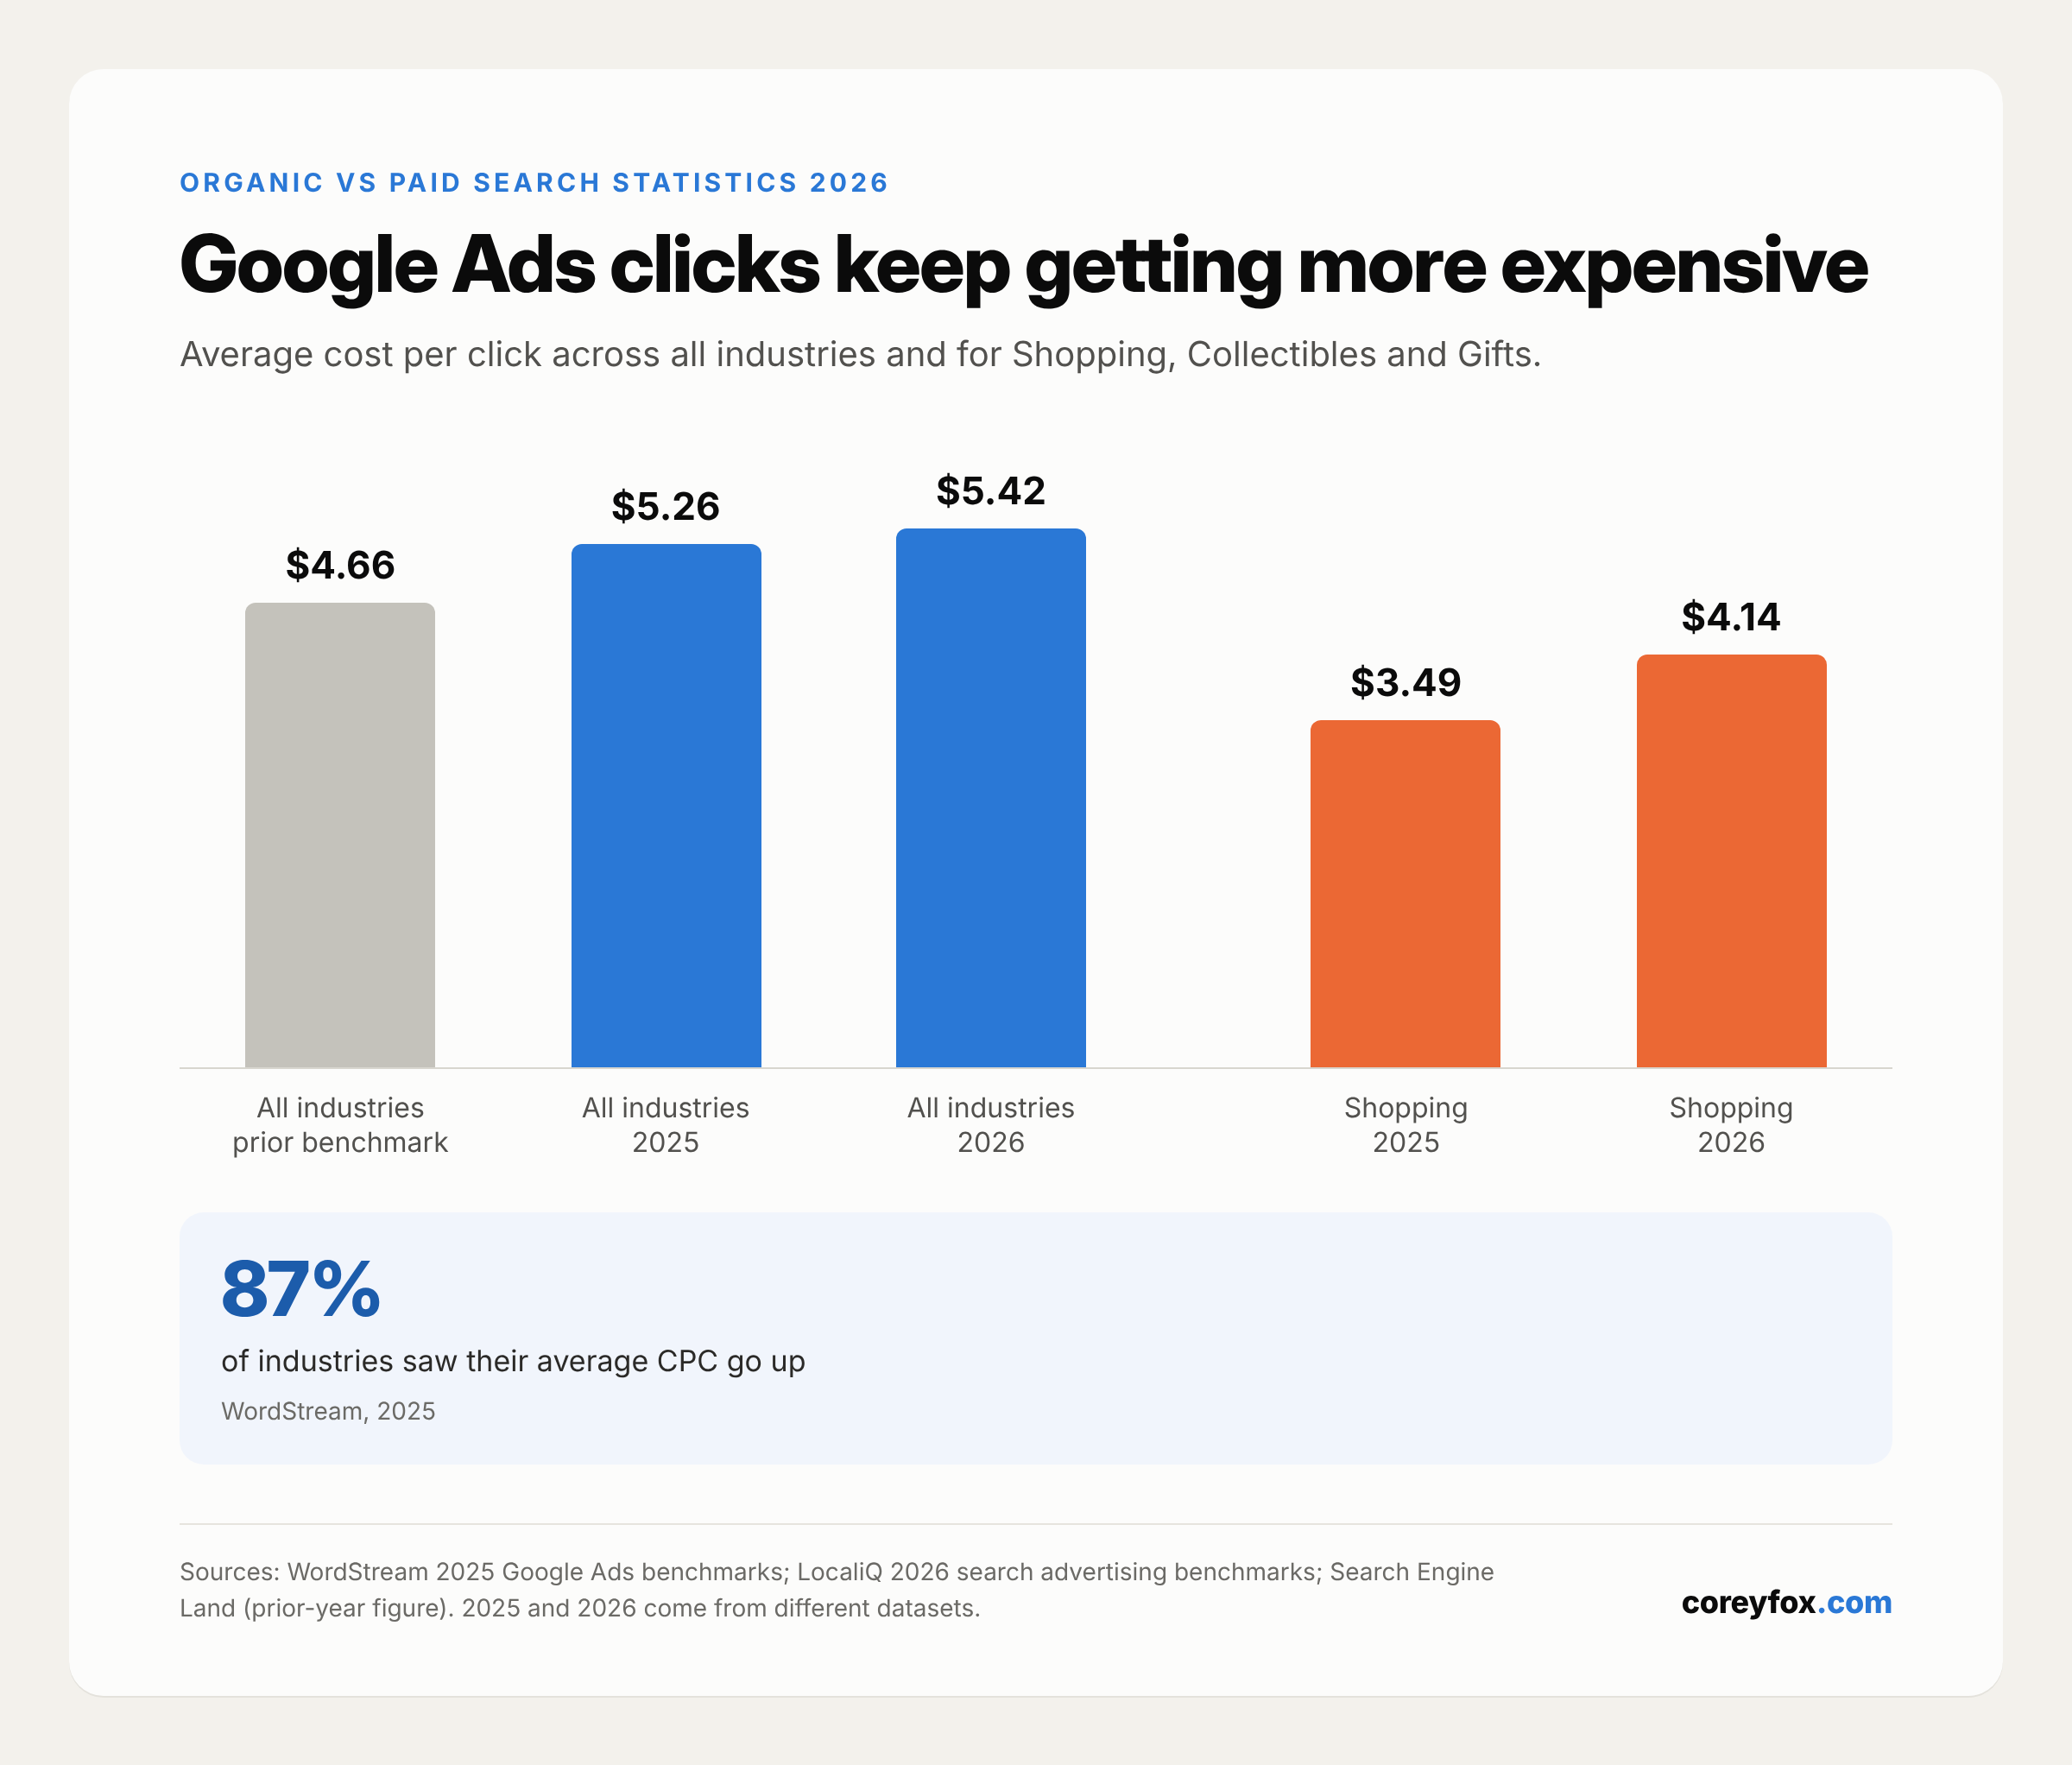
WordStream’s 2025 report covers April 2024 to March 2025. LocaliQ’s 2026 benchmarks are the newer set. Both are from the same company, so the year-over-year direction is the useful part.
- $5.26 average Google Ads CPC, up 12.88% year over year (WordStream, 2025)
- $4.66 average CPC in the prior year’s benchmark (Search Engine Land, 2025)
- 87% of industries saw CPCs increase (WordStream, 2025)
- 7.52% average conversion rate, up 6.84%, and $70.11 average cost per lead, up 5.13% (WordStream, 2025)
- $5.42 average CPC and 8.18% average conversion rate in the 2026 benchmarks (LocaliQ, 2026)
- $66.69 average cost per lead, which LocaliQ says decreased for the first time in five years (LocaliQ, 2026)
- Nearly 29% of Google Ads accounts had zero conversions over a 90-day period (Search Engine Land, 2025)
- $4.84 vs $2.14: average CPC for finance keywords with an AI Overview vs without one (Semrush, 2026)
Ecommerce and shopping categories
- $3.49 average CPC for Shopping, Collectibles and Gifts, up 33.72% year over year, with an 8.92% CTR and 3.83% conversion rate (WordStream, 2025)
- $4.14 average CPC for Shopping, Collectibles and Gifts in 2026, with a 4.01% conversion rate (LocaliQ, 2026)
- $5.70 average CPC for Beauty and Personal Care, up 60.11% year over year (WordStream, 2025)
- $101.49 average cost per lead for Apparel, Fashion and Jewelry, up 23.36%, at a $4.31 CPC (WordStream, 2025)
- $4.44 CPC and 4.50% conversion rate for Apparel, Fashion and Jewelry in 2026 (LocaliQ, 2026)
Ad blocking and ad avoidance
- About 1.1 billion people used ad blockers in Q4 2025, up 13% since 2023 (eyeo, 2026)
- About 30% of the global internet population blocks ads (eyeo, 2026)
- 33% ad-block rate in the United States (eyeo, 2026)
- 629 million mobile ad-block users, up 27% since 2023, while desktop fell 4% to 448 million (eyeo, 2026)
- 81% of US respondents were concerned about devices recording browsing history for targeted ads (eyeo/The Harris Poll, 2026)
Google’s share of search
- 89.94% worldwide search engine market share for Google in September 2026, vs 5.29% for Bing (StatCounter, 2026)
- 85.19% US search engine market share for Google, vs 9.89% for Bing (StatCounter, September 2026)
- $63.27 billion in Google Search and other revenue in Q2 2026, up 17% year over year (Alphabet Q2 2026 earnings release, 2026)
What this means for ecommerce brands
- Paid is rented traffic, and rent keeps going up. CPCs rose in 87% of industries and the cost of a site visit rose 9% two years running. The day you stop paying, that traffic stops. That’s fine for launches and high-margin SKUs. It’s a problem when it’s your only engine.
- Organic compounds, but it’s getting fewer clicks per ranking. A page that ranks keeps working without a click bill. Expect less traffic per position than you got in 2023, though, and judge SEO on revenue per session (organic AOV was slightly higher than paid in the Grips data), not raw sessions.
- AI answers hit both channels. Seer saw paid CTR fall harder than organic CTR on AI Overview queries. Switching budget from SEO to ads doesn’t get you out of the AI layer. It puts you in a more expensive version of it.
- Getting cited in the answer is the new ranking. Cited brands got 35% more organic clicks and 91% more paid clicks. Structured product data, clear comparison content and third-party mentions are what get you into AI answers. I’d treat that as part of SEO now, not a separate project.
- Fix conversion before buying more clicks. Paid converted better than organic in the Grips data (2.4% vs 1.6%), but conversion rates fell 9% in Contentsquare’s data. If your product pages leak, every channel gets more expensive.
- Run them together. Use paid search data to find which queries convert, then build organic pages for those terms so you’re not paying for them forever.
Want to see where your own store is losing search revenue? Run the free Shopify Revenue Leak Audit, or see how my Shopify SEO and AEO services work.
FAQ
What percentage of website traffic comes from organic search vs paid search?
It depends on the dataset. BrightEdge’s 2019 research put organic at 53% of trackable traffic and organic plus paid at 68%. On US ecommerce sites from October 2025 to April 2026, Grips Intelligence measured 21% of sessions from organic search and 22% from paid search.
What is the average CTR for the number one result on Google?
First Page Sage’s 2026 data puts blended position-1 CTR at 7.1%, or 22.6% when no AI answer appears and 3.6% when one does. Backlinko’s older, larger analysis found 27.6%.
Do AI Overviews reduce clicks on Google Ads too?
Yes. Seer Interactive found paid CTR on AI Overview queries fell from 19.70% in June 2024 to 6.34% in September 2025, a steeper decline than organic.
What percentage of Google searches are zero-click?
SparkToro and Datos found 58.5% of US Google searches ended with no click in 2024. Similarweb data reported by Search Engine Roundtable put the share at 69% by May 2025.
What is the average cost per click on Google Ads in 2026?
LocaliQ’s 2026 benchmarks put the average Google Ads CPC at $5.42, up from $5.26 in WordStream’s 2025 report and $4.66 the year before.
Methodology and sources
I built this page in October 2026 from primary sources: original studies, benchmark reports, public earnings filings, and analytics trackers. I opened every linked page and only included a number if it appeared on that page. Where a figure came from a news report of private data (the Similarweb 69% zero-click figure via Search Engine Roundtable), I labeled it that way. I left out widely shared statistics I could not trace to an original source, including the claim that SEO leads close at 14.6%, and I did not include ROI comparisons between SEO and PPC because I found no credible, current primary study.
Keep in mind that sources measure different things. SparkToro, Similarweb and Grips use clickstream or panel data. Ahrefs, Seer and First Page Sage use Search Console or client data. WordStream and LocaliQ report medians from their own advertiser accounts. Compare trends within a source rather than mixing absolute numbers across sources.
Sources: Ahrefs, Advanced Web Ranking, Alphabet, Backlinko, BrightEdge, Contentsquare, eyeo, First Page Sage, Grips Intelligence, LocaliQ, Pew Research Center, Seer Interactive, Semrush, Similarweb, SparkToro, StatCounter, WordStream.