Cart Abandonment Statistics (2026): 50 Verified Stats
Last Updated on October 27, 2026 by Corey Fox
About 7 in 10 online shopping carts never turn into an order. I pulled the most current cart and checkout abandonment data from primary sources (Baymard, Klaviyo, Omnisend, Postscript, Shopify, Adobe, Deloitte and others) so you can cite the real number and the study behind it.
Key statistics
- 70.22% is the average documented online shopping cart abandonment rate, based on 50 studies (Baymard Institute, 2025)
- 40% of US shoppers who abandoned a cart (excluding “just browsing”) said extra costs like shipping, tax and fees were too high (Baymard Institute, 2026 data)
- $260 billion in lost orders is recoverable through better checkout design across the US and EU (Baymard Institute, 2025)
- 79.92% of mobile carts are abandoned, vs 69.19% on desktop (Dynamic Yield, accessed Oct 2026)
- 35.26% is the average conversion rate increase a large ecommerce site could gain from checkout usability fixes (Baymard Institute, 2025)
- 62% of ecommerce sites fail to make guest checkout the most prominent option (Baymard Institute, 2025)
- $6.77 is the average revenue per recipient for a Klaviyo abandoned cart email; the top 10% of brands earn $13.70 (Klaviyo, 2026)
- Up to 50% higher conversion with Shop Pay vs guest checkout (Shopify, study completed April 2023)
- 8.4% lift in retail conversions from a 0.1 second improvement in mobile site speed (Deloitte / Google via web.dev, 2019 data)
- 56.4% of US online holiday spending happened on mobile devices in 2025 (Adobe, 2025)
Average shopping cart abandonment rate
Baymard’s figure is the most cited number in ecommerce. It’s a simple average of 50 separate abandonment studies published between 2006 and 2025, so it’s a long-run benchmark, not a live reading.
- 70.22% is the average documented online shopping cart abandonment rate across 50 studies (Baymard Institute, updated Sept 2025)
- 71.72% was the abandonment rate in the newest study in Baymard’s list, from Uptain (Baymard Institute, 2025)
- 55% to 84.27% is the range of individual study results in Baymard’s dataset (Forrester 2010 low, SaleCycle 2020 high) (Baymard Institute, 2025)
- 77.54% is the global average cart abandonment rate in Dynamic Yield’s live benchmark, calculated as 1 minus (completed purchases ÷ carts created) (Dynamic Yield, accessed Oct 2026)
Mobile cart abandonment and abandonment by device
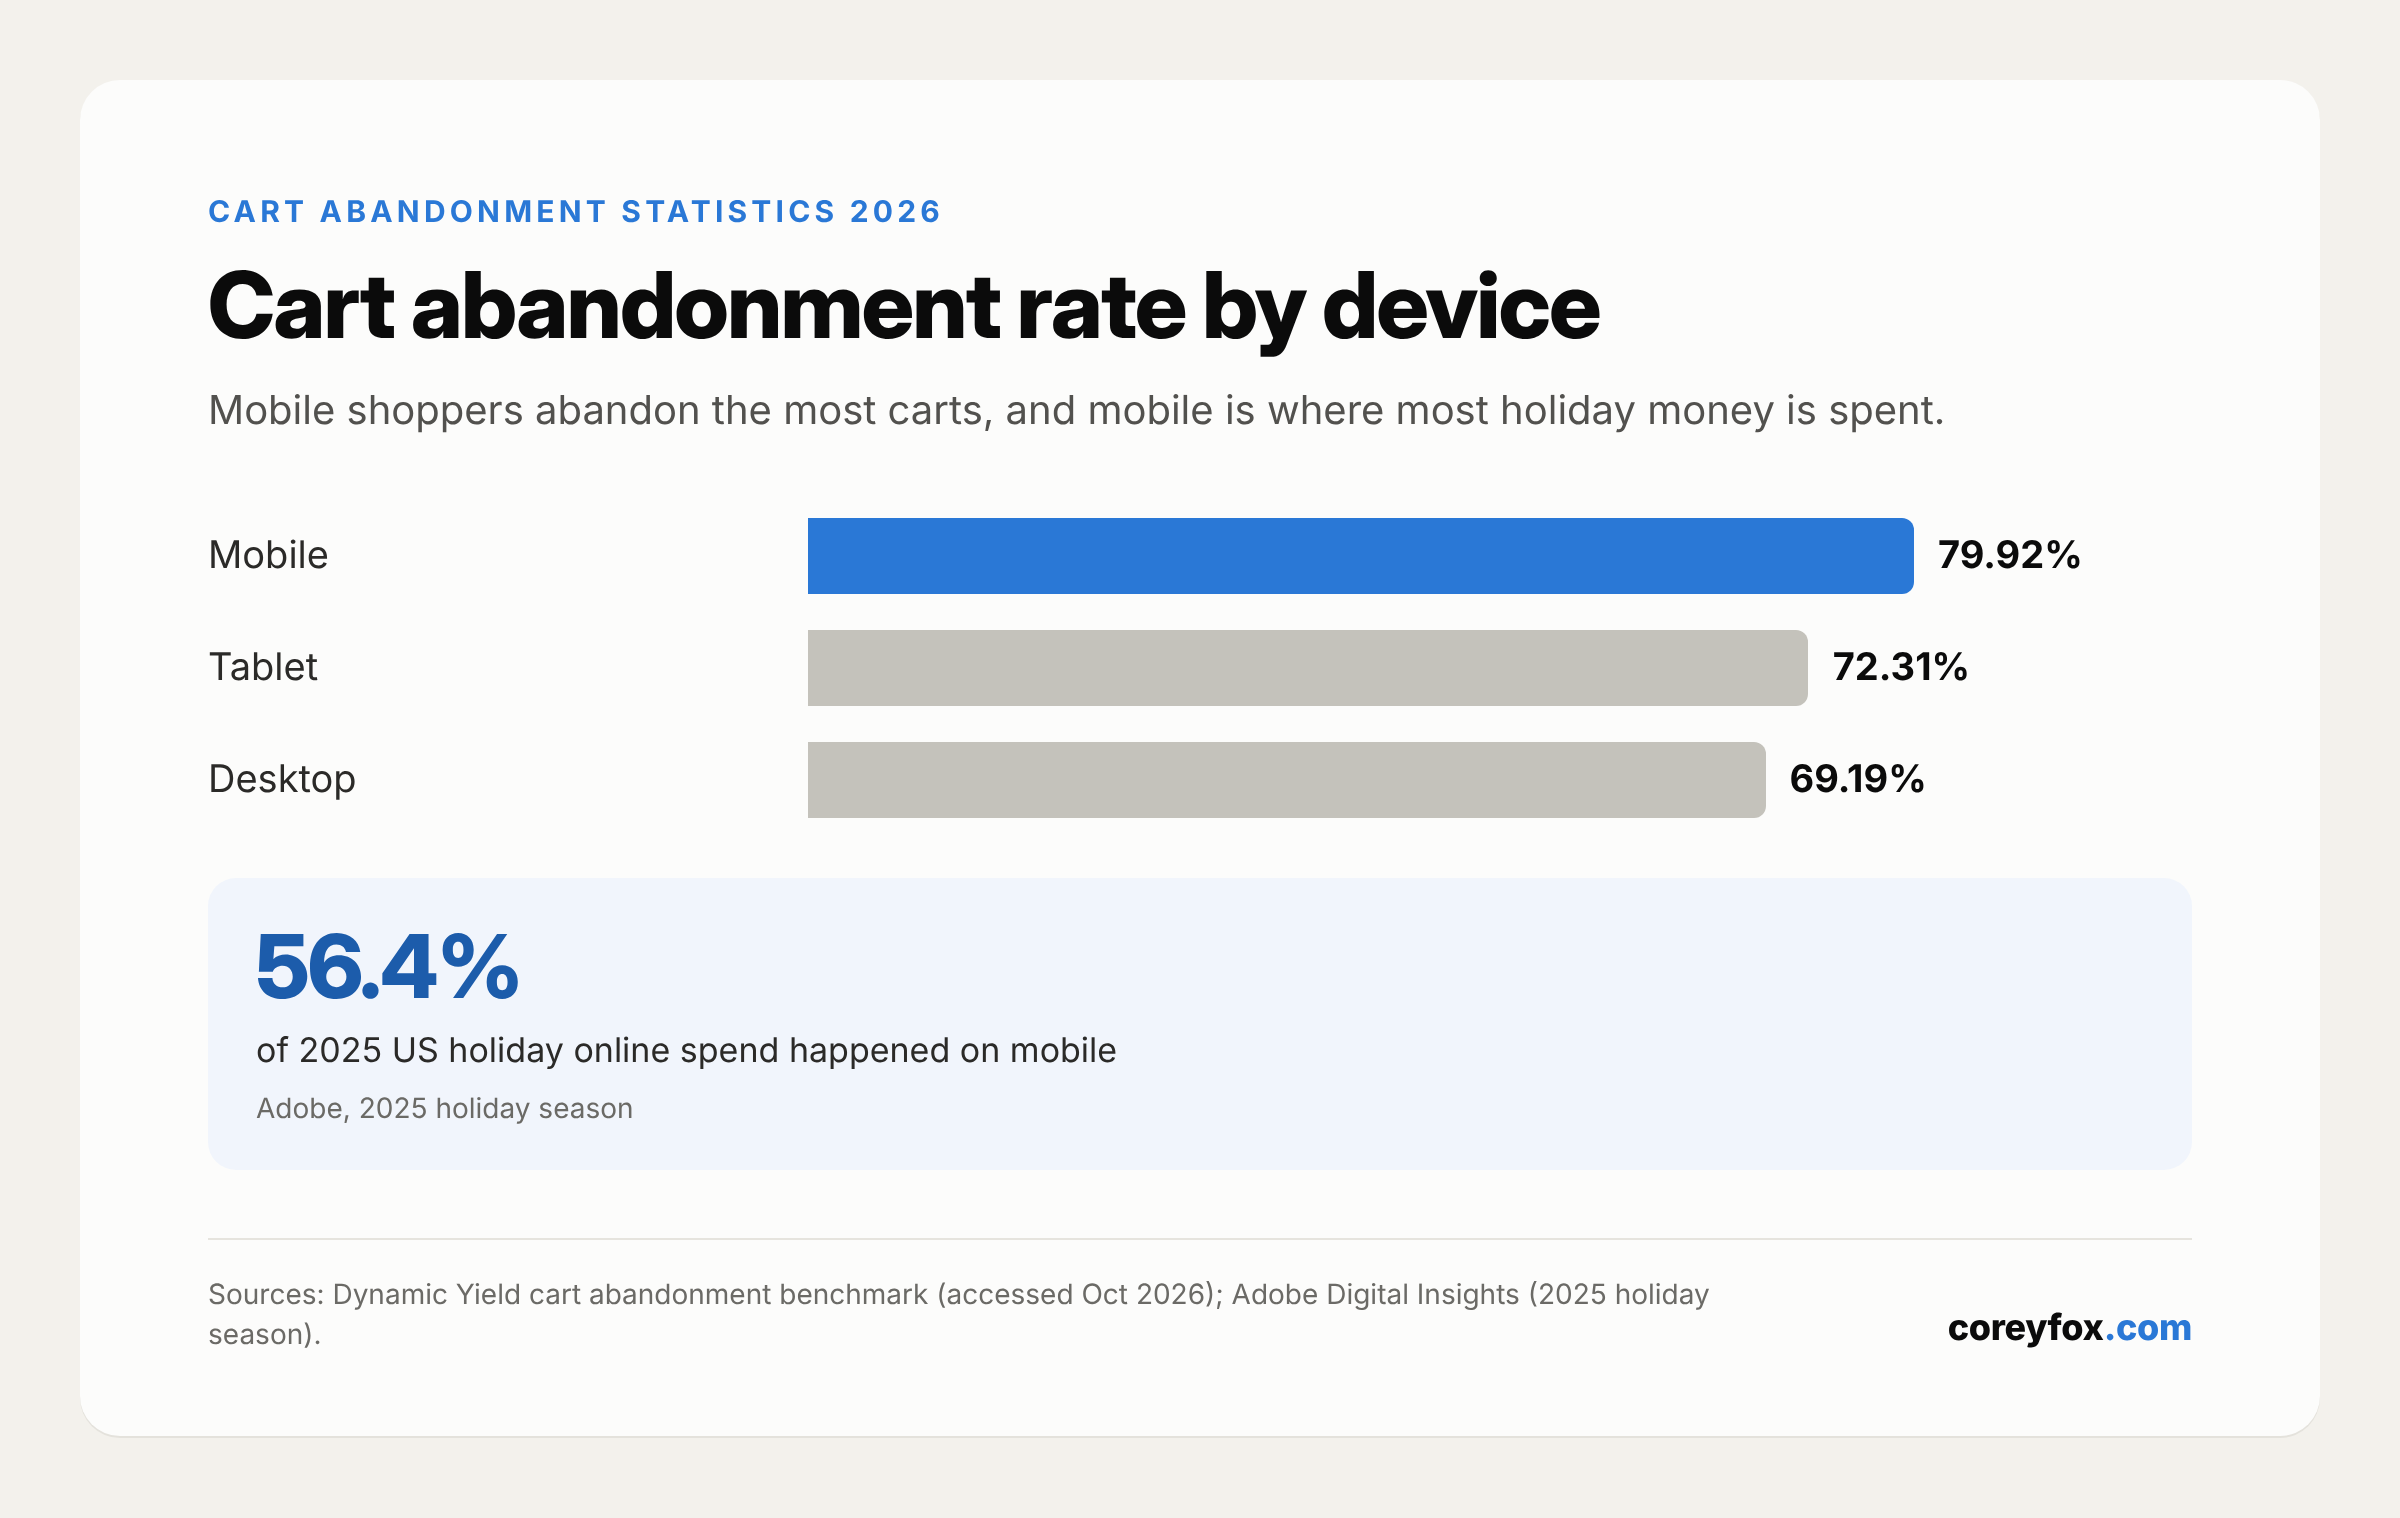
Mobile carries most of the traffic and most of the abandonment.
- 79.92% cart abandonment rate on mobile (Dynamic Yield, accessed Oct 2026)
- 72.31% cart abandonment rate on tablet (Dynamic Yield, accessed Oct 2026)
- 69.19% cart abandonment rate on desktop (Dynamic Yield, accessed Oct 2026)
- 56.4% of US online holiday spend (Nov 1 to Dec 31) came from mobile, up from 54.5% in 2024 (Adobe, 2025)
- 66.5% of US online spending on Christmas Day 2025 was on mobile (Adobe, 2025)
- 75% of mobile ecommerce sites are rated only “mediocre” for mobile UX, and just 1 of 150+ benchmarked sites rated “good” (Baymard Institute, 2026)
Cart abandonment rate by industry and region
Category matters a lot. Food and beauty sit near 80%, while pet care is closer to half.
- 80.94% cart abandonment in Food & Beverage, the highest monthly rate in the benchmark (June) (Dynamic Yield, accessed Oct 2026)
- 79.81% cart abandonment in Beauty & Personal Care, the highest vertical over the trailing 12 months (Dynamic Yield, accessed Oct 2026)
- 51.1% cart abandonment in Pet Care & Veterinary Services, the lowest vertical over the trailing 12 months (Dynamic Yield, accessed Oct 2026)
- 81.21% cart abandonment rate in APAC (Dynamic Yield, accessed Oct 2026)
- 79.17% cart abandonment rate in EMEA (Dynamic Yield, accessed Oct 2026)
- 74.46% cart abandonment rate in the Americas (Dynamic Yield, accessed Oct 2026)
Why shoppers abandon carts
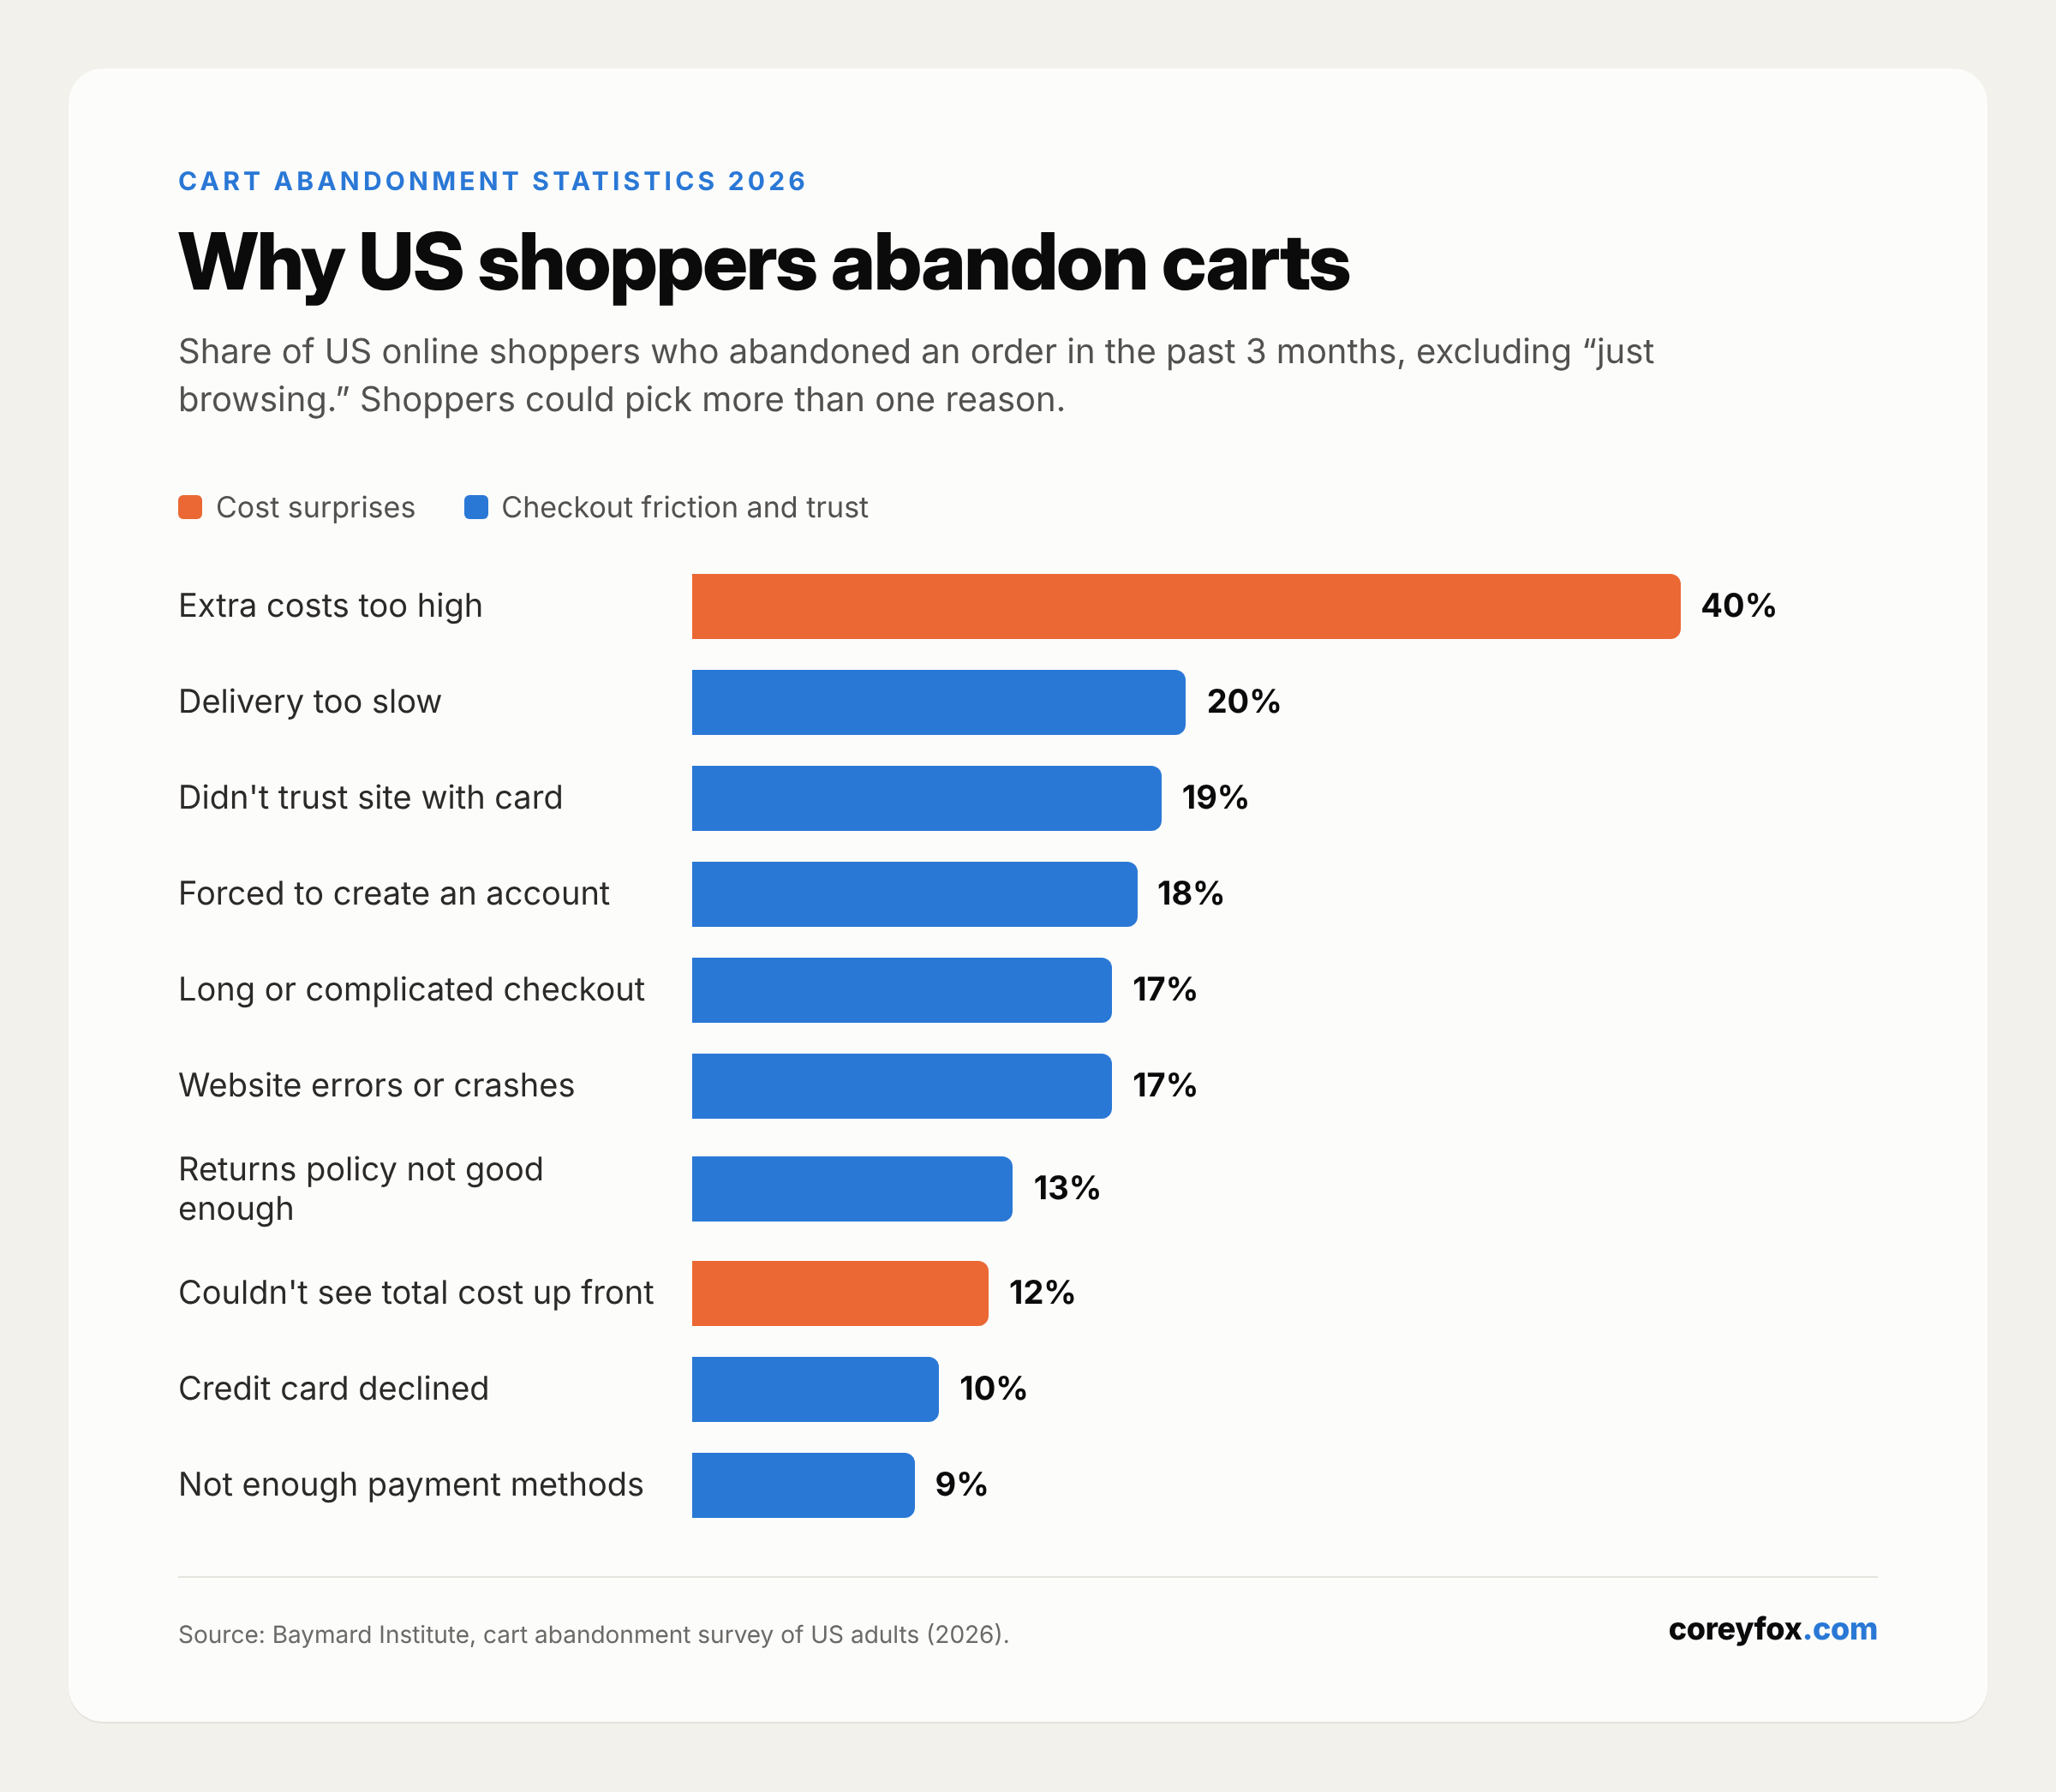
Baymard surveys US online shoppers about carts they abandoned in the prior three months. The latest round uses March 2026 data. The biggest group isn’t a UX problem at all: they were just browsing. The rest is mostly cost and friction.
- 42% of US online shoppers abandoned a cart because they were “just browsing / not ready to buy” (Baymard Institute, 2026 data)
Excluding “just browsing,” US shoppers abandoned because:
- 40%: extra costs too high (shipping, tax, fees) (Baymard Institute, 2026 data)
- 20%: delivery was too slow (Baymard Institute, 2026 data)
- 19%: didn’t trust the site with their credit card information (Baymard Institute, 2026 data)
- 18%: the site wanted them to create an account (Baymard Institute, 2026 data)
- 17%: checkout process was too long or complicated (Baymard Institute, 2026 data)
- 17%: the website had errors or crashed (Baymard Institute, 2026 data)
- 13%: returns policy wasn’t satisfactory (Baymard Institute, 2026 data)
- 12%: couldn’t see or calculate the total order cost up front (Baymard Institute, 2026 data)
- 10%: credit card was declined (Baymard Institute, 2026 data)
- 9%: not enough payment methods (Baymard Institute, 2026 data)
Revenue lost and recoverable
- $260 billion in lost orders is recoverable through better checkout flow and design alone, out of $738 billion in combined US and EU ecommerce sales (Baymard Institute, 2025)
- 35.26% is the average conversion rate increase available to a large ecommerce site by fixing checkout usability issues (Baymard Institute, 2025)
- 39 potential checkout improvements were found, on average, per leading ecommerce site benchmarked (Baymard Institute, 2025)
Checkout UX findings
Baymard’s 2025 checkout benchmark covers 41,000+ checkout scores. Even large, well-funded sites get the basics wrong.
- 64% of desktop ecommerce sites have “mediocre” or worse checkout UX, and only 2% rate “good” (Baymard Institute, 2025)
- 63% of mobile sites have “mediocre” or worse checkout UX (Baymard Institute, 2025)
- 23.48 form elements are shown in the average US checkout by default, vs an ideal of 12 to 14 (Baymard Institute, 2025)
- 20% to 60% of shown form elements could be cut from most checkouts (Baymard Institute, 2025)
- 62% of sites fail to make guest checkout the most prominent option (Baymard Institute, 2025)
- 19% checkout abandonment rate was observed among existing users struggling with strict password rules at sign-in (Baymard Institute, 2025)
- 48% of sites show delivery speed (“3 to 5 business days”) instead of an actual delivery date (Baymard Institute, 2025)
- 83% of sites don’t show the order cutoff time as a countdown (Baymard Institute, 2025)
- 70%+ of survey respondents said they’re reluctant to give a phone number, yet 49% of sites don’t explain why it’s required (Baymard Institute, 2025)
Abandoned cart email and SMS recovery benchmarks
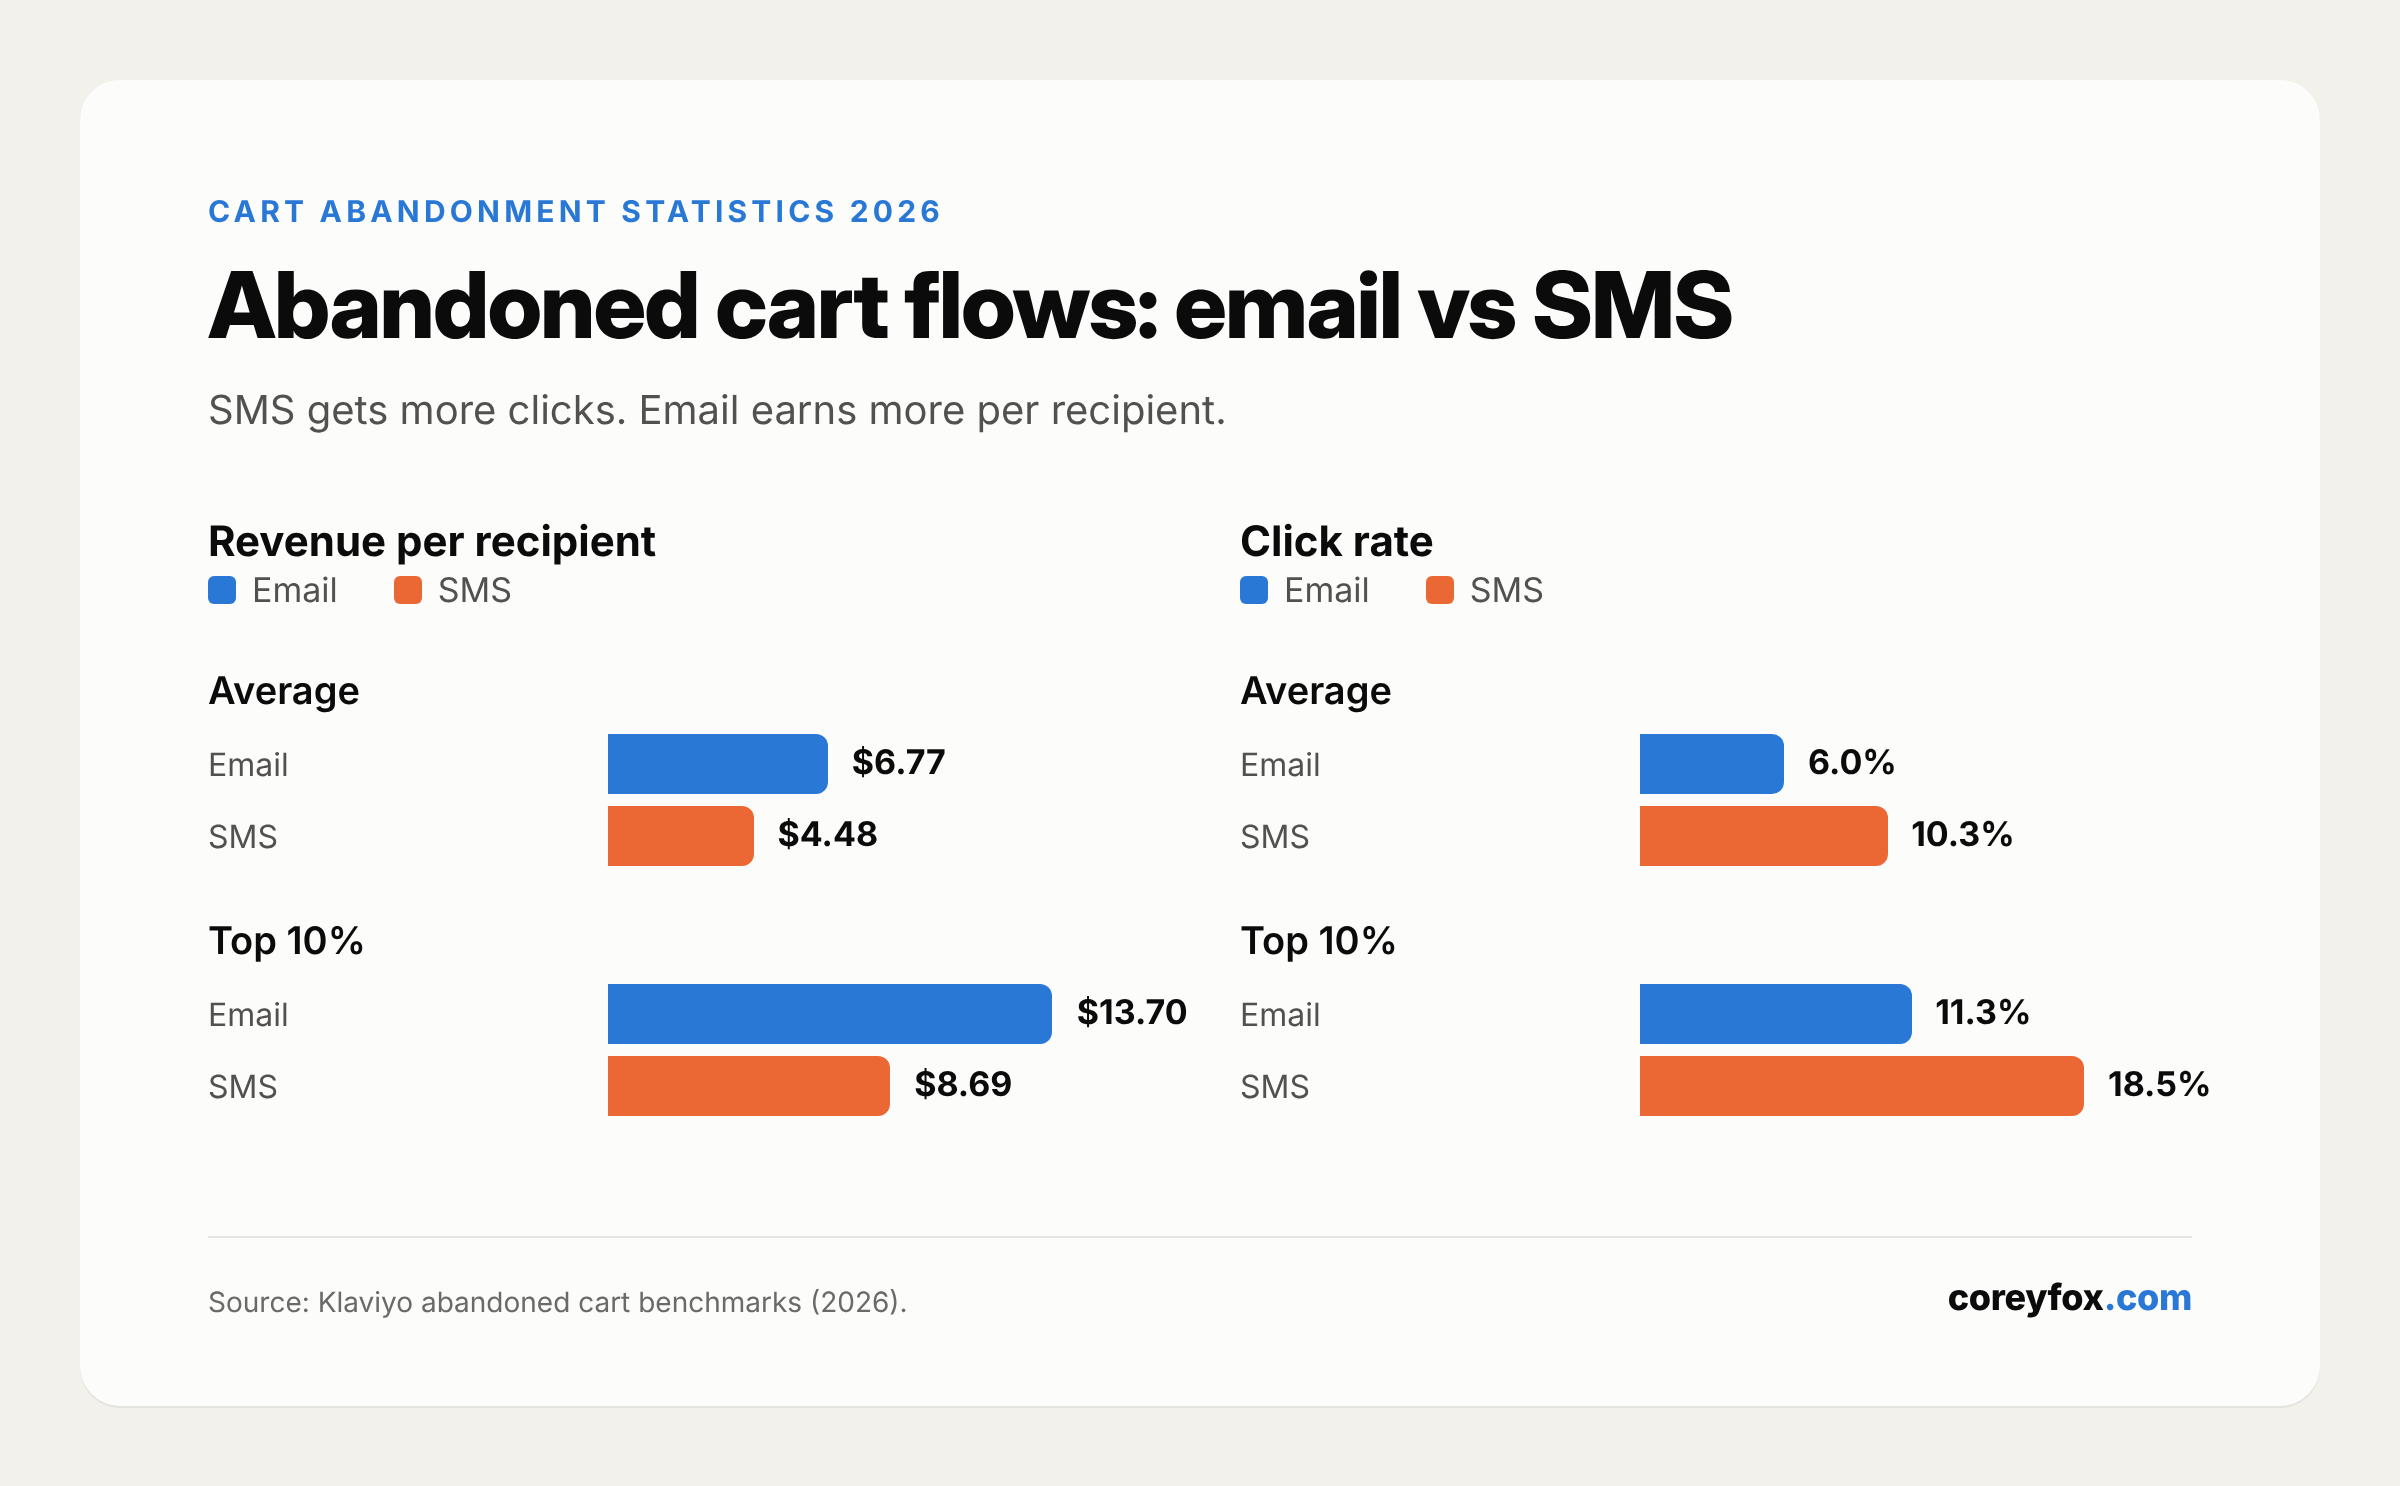
Abandoned cart flows are consistently among the highest-earning automations in email and SMS. Here’s what the platforms report.
- $6.77 average revenue per recipient (RPR) for abandoned cart emails; $13.70 for the top 10% of brands (Klaviyo, 2026, 110,000+ customers)
- 6.0% average click rate for abandoned cart emails; 11.3% for the top 10% (Klaviyo, 2026)
- $35.24 RPR for top-10% abandoned cart emails in hardware and home improvement, the highest of any vertical Klaviyo broke out (Klaviyo, 2026)
- 35.75% average open rate for abandoned cart emails (Omnisend, 2025 data)
- 1.51% average conversion rate for abandoned cart emails, with $2.54 revenue per delivered email (Omnisend, 2025 data)
- $168 average order value of carts recovered by abandoned cart emails (Omnisend, 2025 data)
- 76% of all automation-generated orders came from abandoned cart and welcome emails combined (Omnisend, 2025 data)
- 2% of email sends were automations, but they drove 30% of email-attributed revenue (Omnisend, 2025 data)
- $2.87 revenue per send for automated emails vs $0.18 for scheduled campaigns, about 16x (Omnisend, 2025 data)
SMS
- $4.48 average RPR for abandoned cart texts; $8.69 for the top 10% (Klaviyo, 2026)
- 10.3% average click rate for abandoned cart texts; 18.5% for the top 10% (Klaviyo, 2026)
- 3.97% to 7.84% conversion rate for abandoned cart SMS (25th to 75th percentile), vs 0.12% to 0.54% for SMS campaigns (Postscript, Jan 1 to Dec 15, 2025 data)
- 9.53% to 17.28% click rate for abandoned cart SMS (25th to 75th percentile) (Postscript, 2025 data)
Shopify checkout and Shop Pay data
These are Shopify’s own figures from a study it commissioned with an unnamed “Big Three” consulting firm (completed April 2023). Treat them as vendor data, but they’re the numbers Shopify publishes.
- Up to 50% higher conversion with Shop Pay compared to guest checkout (Shopify, April 2023 study)
- At least 10% higher conversion for Shop Pay vs other accelerated checkouts (Shopify, April 2023 study)
- 5% lift in lower-funnel conversion from the mere presence of Shop Pay at checkout (Shopify, April 2023 study)
- 15% average conversion advantage for Shopify Checkout over competing platforms, and up to 36% (Shopify, 2023)
- 4x faster checkout with Shop Pay than guest checkout (Shopify, 2023)
- Nearly 1 in 3 orders use Shop Pay when a brand offers it, per internal Shopify data (Shopify, accessed Oct 2026)
Express and one-click checkout impact
- 80%+ of Fastlane guest shoppers converted in BigCommerce tests, up to 50% better than non-Fastlane shoppers (PayPal, 2024)
- 32% reduction in checkout time with Fastlane, with purchases completed in as little as 2 minutes (PayPal, 2024)
- 74% to 86%: guest checkout conversion at Black Forest Decor before and after adding Fastlane (PayPal, 2024)
- $20 billion was spent through buy now, pay later during the 2025 US holiday season, up 9.8%, with 82.2% of BNPL purchases made on smartphones (Adobe, 2025)
Site speed impact on conversion
The best speed studies are a few years old, but they’re still the standard references.
- 8.4% increase in retail conversions and 9.2% increase in retail spend from a 0.1 second improvement in mobile site speed, across 37 brand sites and 30M+ sessions (Deloitte / Google via web.dev, 2019 data)
- 4.7% improvement in retail checkout-to-order progression from that same 0.1 second gain (Deloitte / Google via web.dev, 2019 data)
- 3.05% ecommerce conversion rate for pages loading in 1 second, vs 1.68% at 2 seconds and 1.12% at 3 seconds (Portent, 2022)
- 113% increase in the probability of a mobile visitor bouncing as page load time goes from 1 to 7 seconds (Think with Google, 2017)
What this means for Shopify brands
- Show the full cost early. Extra costs (40%) and not seeing the total up front (12%) are two of the top reasons people leave. Put shipping thresholds and estimated tax on the product page and cart, not just at the last step.
- Show a delivery date, not a delivery speed. Slow delivery is the #2 reason (20%), and 48% of sites still say “3 to 5 business days.” A real date plus a cutoff countdown is a cheap fix.
- Turn on Shop Pay and other accelerated checkouts above the fold of the cart. Even if you discount Shopify’s numbers, forced account creation (18%) and long checkouts (17%) are friction that express buttons remove.
- Run both email and SMS abandoned cart flows. Klaviyo’s data shows email earns more per recipient while SMS gets roughly 1.7x the click rate. If you only run one, you’re leaving the other channel’s buyers on the table.
- Treat mobile speed as a checkout metric. A 0.1 second gain moved checkout-to-order progression 4.7% in Deloitte’s study. Audit apps and scripts that load on cart and product pages first.
- Put your shipping and returns policy where buyers and search engines can see it. 13% abandon over returns policy. Clear policy pages plus structured data (the Shopify Schema Kit covers this) help on both the trust and search sides. If you want a quick read on where your own store leaks, run the free Shopify Revenue Leak Audit, or talk to me about ongoing SEO and AEO work.
FAQ
What is the average cart abandonment rate in 2026?
Baymard Institute’s documented average is 70.22%, based on 50 studies. Dynamic Yield’s live benchmark puts the global average higher, at 77.54%.
What is the mobile cart abandonment rate?
Dynamic Yield reports a 79.92% abandonment rate on mobile, compared with 72.31% on tablet and 69.19% on desktop.
Why do most shoppers abandon their carts?
42% of US shoppers were just browsing. Among the rest, the top reason is extra costs like shipping, tax and fees (40%), followed by slow delivery (20%) and not trusting the site with card details (19%), per Baymard’s March 2026 data.
How much revenue do abandoned cart emails recover?
Klaviyo reports an average of $6.77 in revenue per recipient for abandoned cart emails, and $13.70 for the top 10% of brands. Omnisend reports a 1.51% average conversion rate and $168 average recovered order value.
Does Shop Pay reduce cart abandonment?
Shopify reports Shop Pay can lift conversion by up to 50% versus guest checkout and by at least 10% versus other accelerated checkouts, based on a study it commissioned in 2023.
Methodology and sources
Every statistic above was checked on the linked source page in October 2026. I prioritized primary sources: research firms (Baymard Institute), platforms reporting on their own customer data (Klaviyo, Omnisend, Postscript, Shopify, PayPal, Adobe, Dynamic Yield) and original speed studies (Deloitte/Google, Portent). Notes on specific sources:
- Baymard’s 70.22% is an unweighted average of 50 third-party studies from 2006 to 2025. Baymard’s abandonment reasons come from its own survey of US adults (study GC050, March 2026 data); the percentages exclude respondents who were “just browsing.”
- Dynamic Yield is a live, rolling benchmark. The page does not state a sample size or exact date range, so I’ve labeled those figures by access date.
- Klaviyo, Omnisend and Postscript figures reflect each platform’s own customers and differ in how they define and attribute conversions, so they aren’t directly comparable.
- Shopify and PayPal figures are vendor-published and based on studies they commissioned or ran.
- Speed studies (Deloitte 2019 data, Portent 2022, Google 2017) are older but remain the most widely cited original research on the topic.
Last updated: October 27, 2026.