Ecommerce Return Rate Statistics (2026): 50+ Sourced Stats
Last Updated on October 27, 2026 by Corey Fox
Returns are the biggest cost in ecommerce that never shows up on a product page. US shoppers sent back an estimated $849.9 billion in merchandise in 2025, and a growing share of that is fraud, abuse, or the predictable result of thin product information.
Key statistics
- 19.3% of online sales were expected to be returned in 2025, versus 15.8% of total retail sales (NRF and Happy Returns, 2025)
- $849.9 billion in US retail merchandise was expected to be returned in 2025 (NRF and Happy Returns, 2025)
- 9% of all returns are fraudulent (NRF and Happy Returns, 2025)
- $100 billion (14.2% of returned merchandise) was lost to returns fraud and abuse in 2025, and abuse cost 6x more than outright fraud (Appriss Retail, 2026)
- 45% of shoppers say it’s acceptable to “bend the truth” when returning an item (NRF and Happy Returns, 2025)
- 36% of consumers admit to bracketing: buying multiples on purpose to try at home and return (Rithum, 2025)
- 61% of consumers say poor fit is the main reason they return items (Rithum, 2025)
- 33% of consumers have returned a product that didn’t match its online description or images (Rithum, 2025)
- US merchants lose $4.61 for every $1 of fraud (LexisNexis Risk Solutions, 2025)
- Global chargebacks are forecast to grow from 261 million in 2025 to 324 million in 2028 (Mastercard, 2025)
How much merchandise gets returned (US)
The two big annual US numbers come from NRF/Happy Returns and Appriss Retail. They use different methods, so their totals differ. Cite them separately.
- $849.9 billion in returns were expected in 2025, down from $890 billion in 2024 (NRF and Happy Returns, 2025)
- 15.8% of annual retail sales were expected to be returned in 2025, down from 16.9% in 2024 (NRF and Happy Returns, 2025)
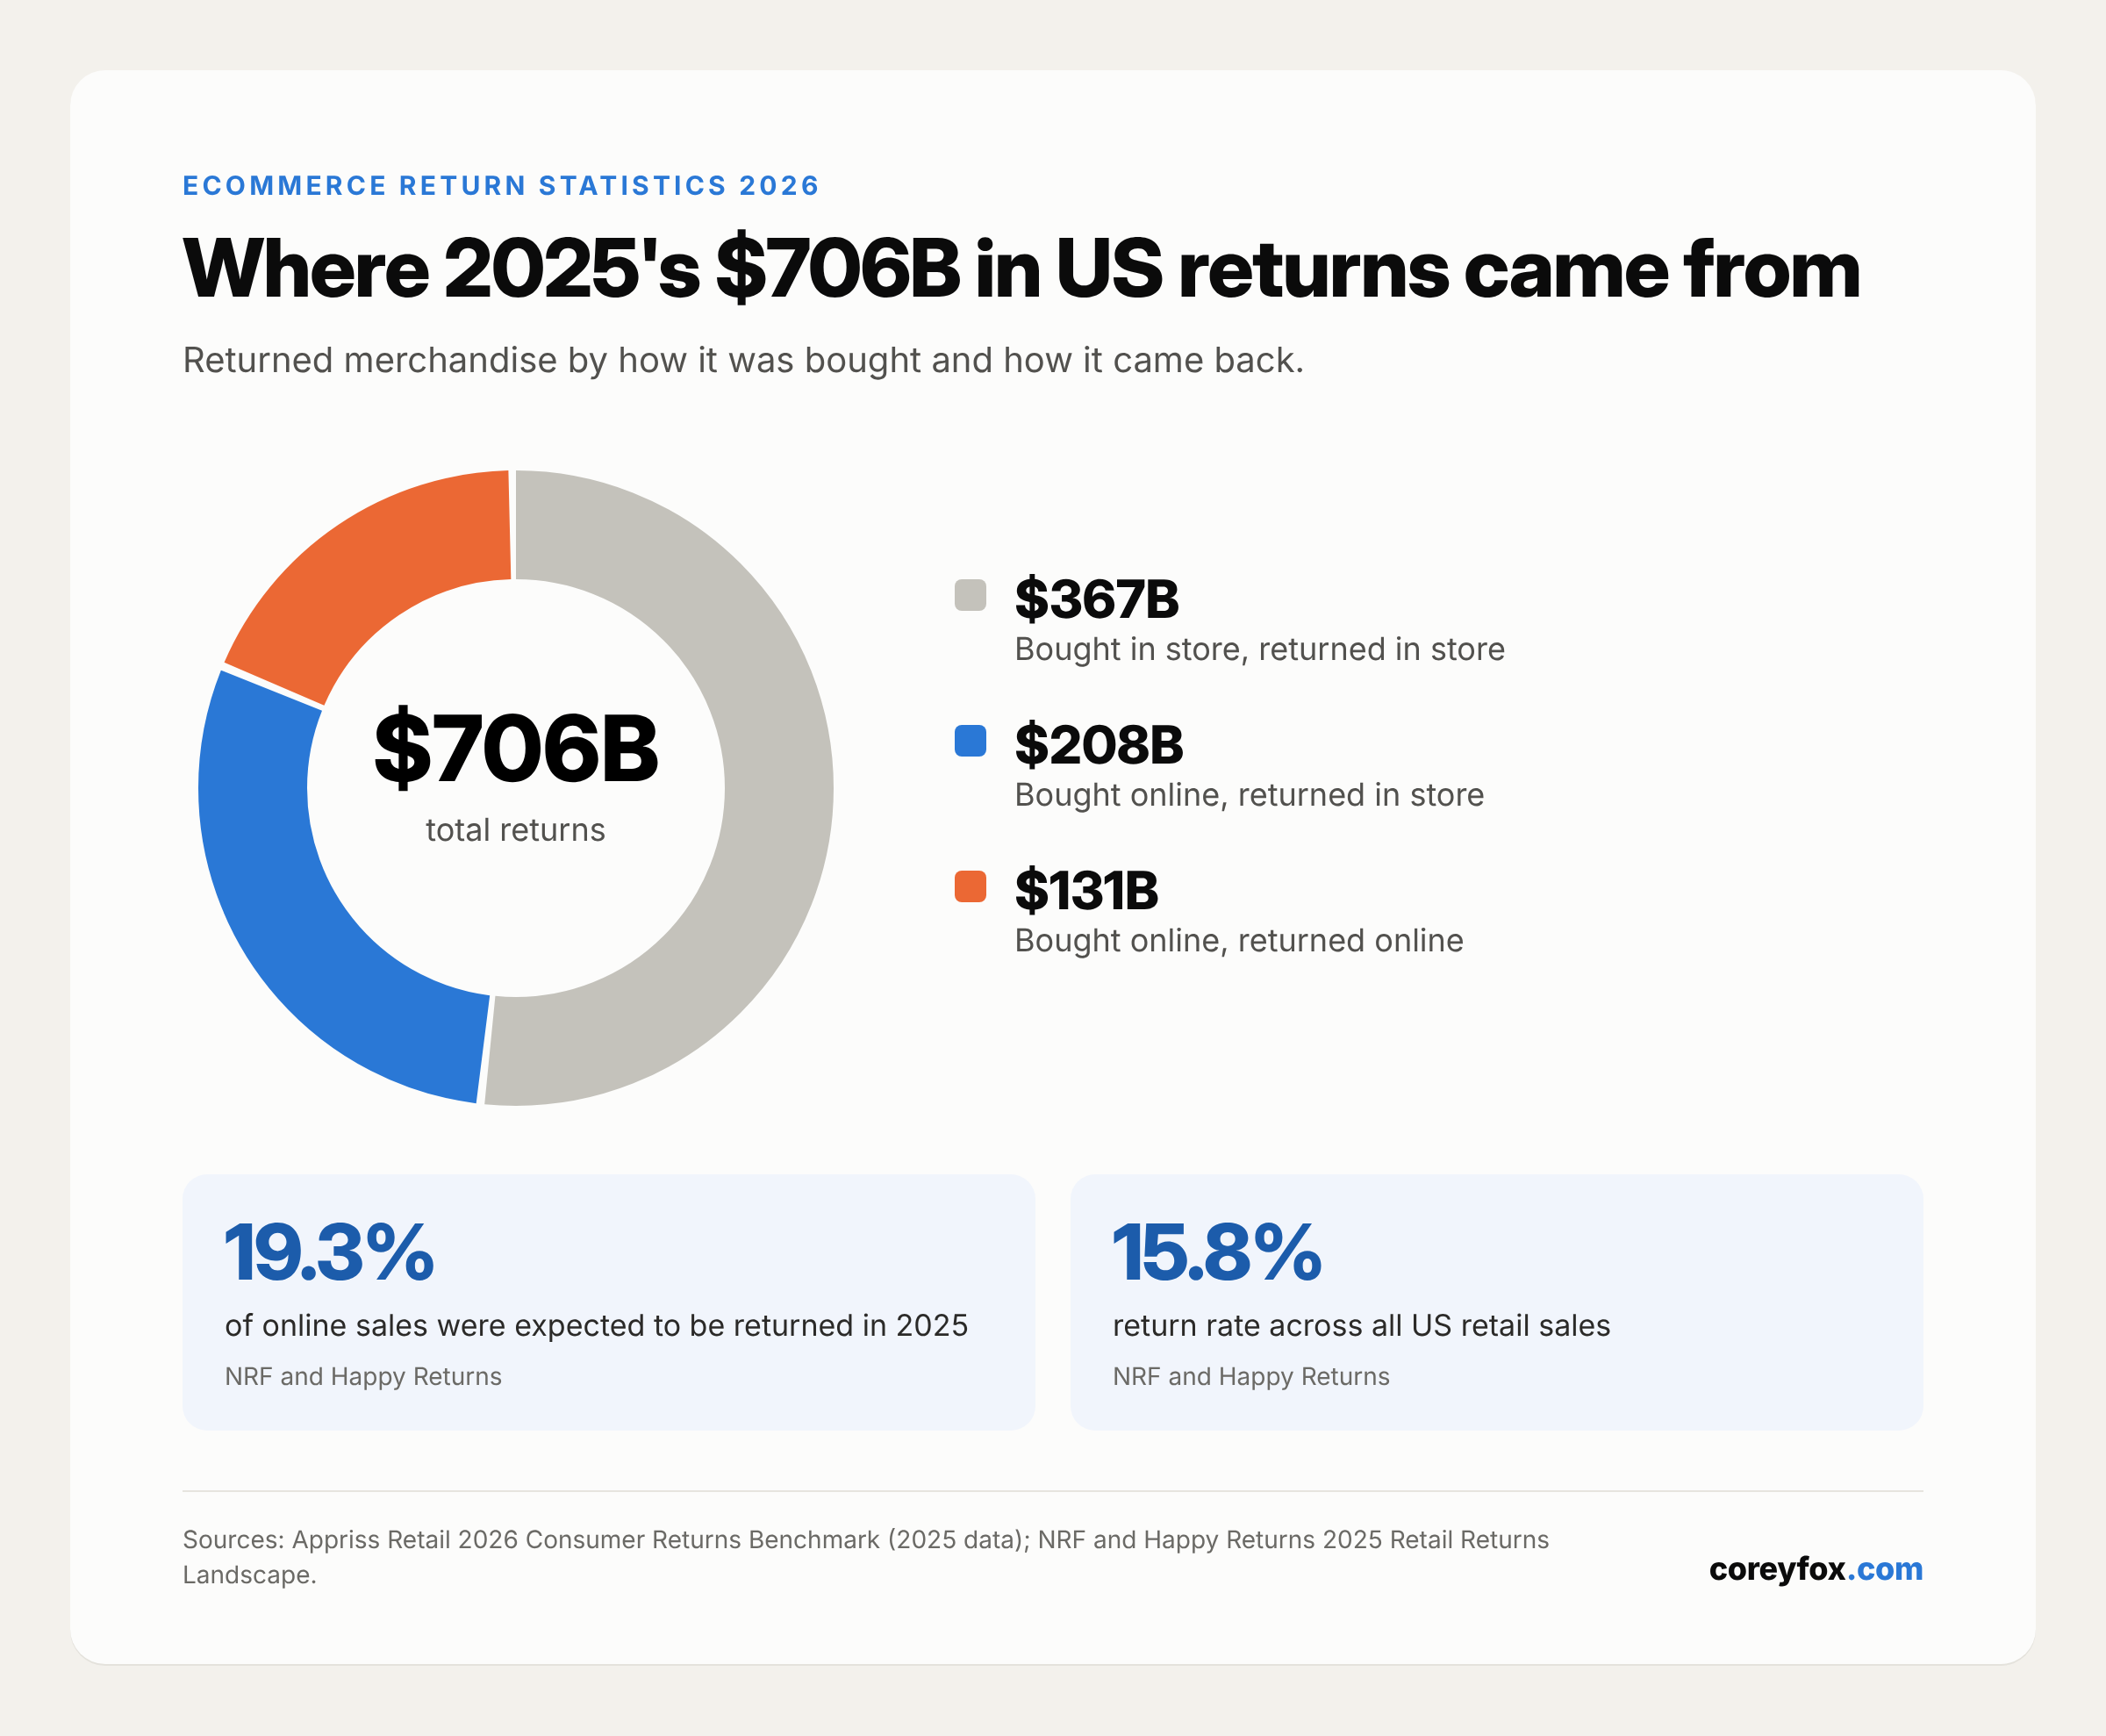
- $706 billion in merchandise was returned in 2025, by Appriss Retail’s count (Appriss Retail, 2026)
- $796 billion in total retail loss came from returns plus shrink in 2025 (Appriss Retail, 2026)
- $685 billion in merchandise was returned in 2024, equal to 13.21% of $5.19 trillion in retail sales (Appriss Retail and Deloitte, 2024)
- Shoppers aged 18 to 30 averaged 7.7 online returns in the past 12 months, more than any other age group (NRF and Happy Returns, 2025)
Online vs in-store return rates
Online purchases come back more often than store purchases. That gap is the cost of a customer who can’t touch, try on, or measure the product before buying.
- 19.3% of online sales were expected to be returned in 2025, compared with 15.8% across all retail sales (NRF and Happy Returns, 2025)
- Buy in-store, return in-store made up 52% ($367 billion) of 2025 returns (Appriss Retail, 2026)
- Buy online, return in-store made up 29% ($208 billion) of 2025 returns, and Appriss calls it the fastest-growing fraud and abuse channel (Appriss Retail via Chain Store Age, 2026)
- Buy online, return online made up 19% ($131 billion) of 2025 returns (Appriss Retail, 2026)
Return rate by category
Clean, public category-level return rates are scarce. Most come from returns platforms reporting on their own merchants, so treat them as benchmarks, not census data.
- Apparel had a 24.4% average online return rate in the 12 months ended March 2023, per a survey of 100 US apparel brands and retailers (Coresight Research, 2023)
- UK clothing ecommerce orders have an average return rate of 23.6% (ZigZag, 2025)
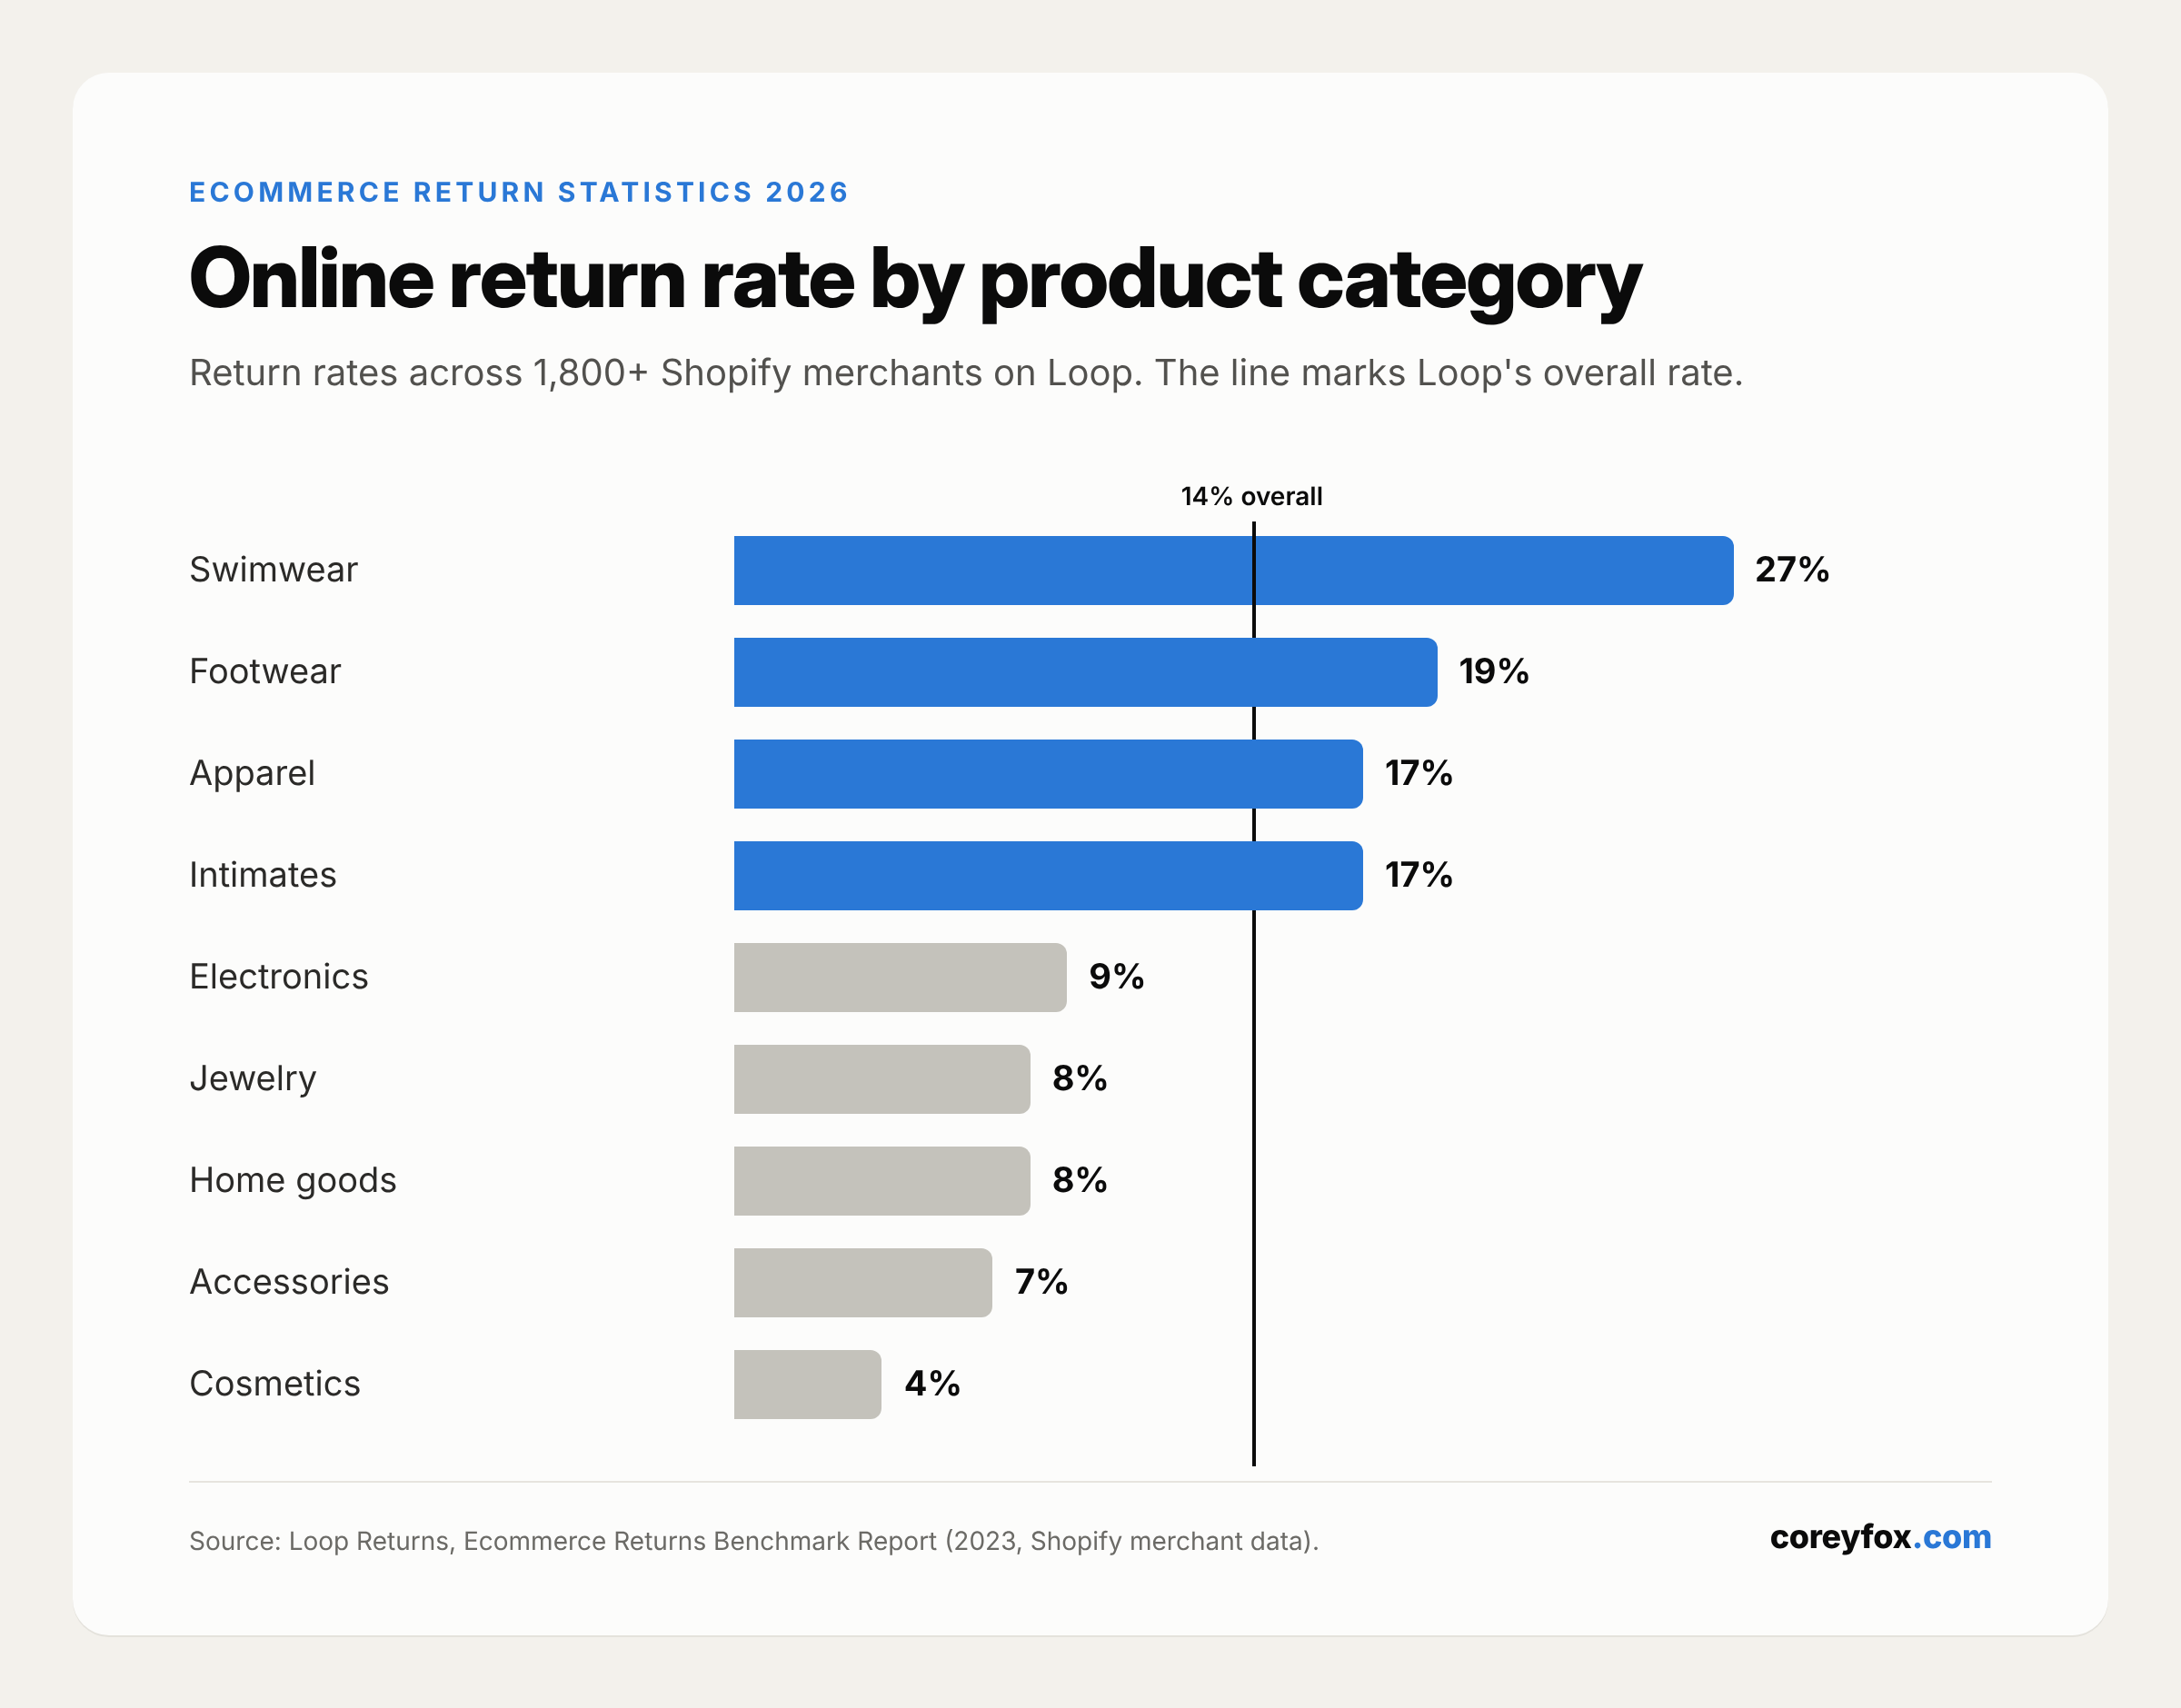
- Across 1,800+ Shopify merchants on Loop, return rates by vertical were: swimwear 27%, footwear 19%, apparel 17%, intimates 17%, electronics 9%, jewelry 8%, home goods 8%, accessories 7% and cosmetics 4%, with 14% overall (Loop Returns Ecommerce Returns Benchmark Report, 2023)
- 56% of apparel returns and 61% of footwear returns are due to fit or size (Loop Returns, 2026)
- 45% of cosmetics and personal care returns are for style or preference reasons (Loop Returns, 2026)
- 13% of electronics returns are for damaged or defective items, while 46% fall under “other,” often “no longer needed” (Loop Returns, 2026)
Bracketing and serial returners
Bracketing means buying the same item in multiple sizes or colors with a plan to send most of it back. It’s normal behavior now, especially for younger shoppers.
- 36% of consumers admit to bracketing (Rithum, 2025)
- 51% of Gen Z consumers say they bracket (NRF and Happy Returns, 2024)
- Close to two-thirds of consumers admit to at least one costly return behavior, such as bracketing or wardrobing (NRF and Happy Returns, 2025)
- 39% of consumers make an online return at least once a month (Narvar via Chain Store Age, 2024)
Why customers return things
Fit is the top reason in almost every survey. “Not as described” and “arrived damaged” follow. Two of those three are product page problems.
- 61% of consumers say poor fit is the main reason they return items (Rithum, 2025)
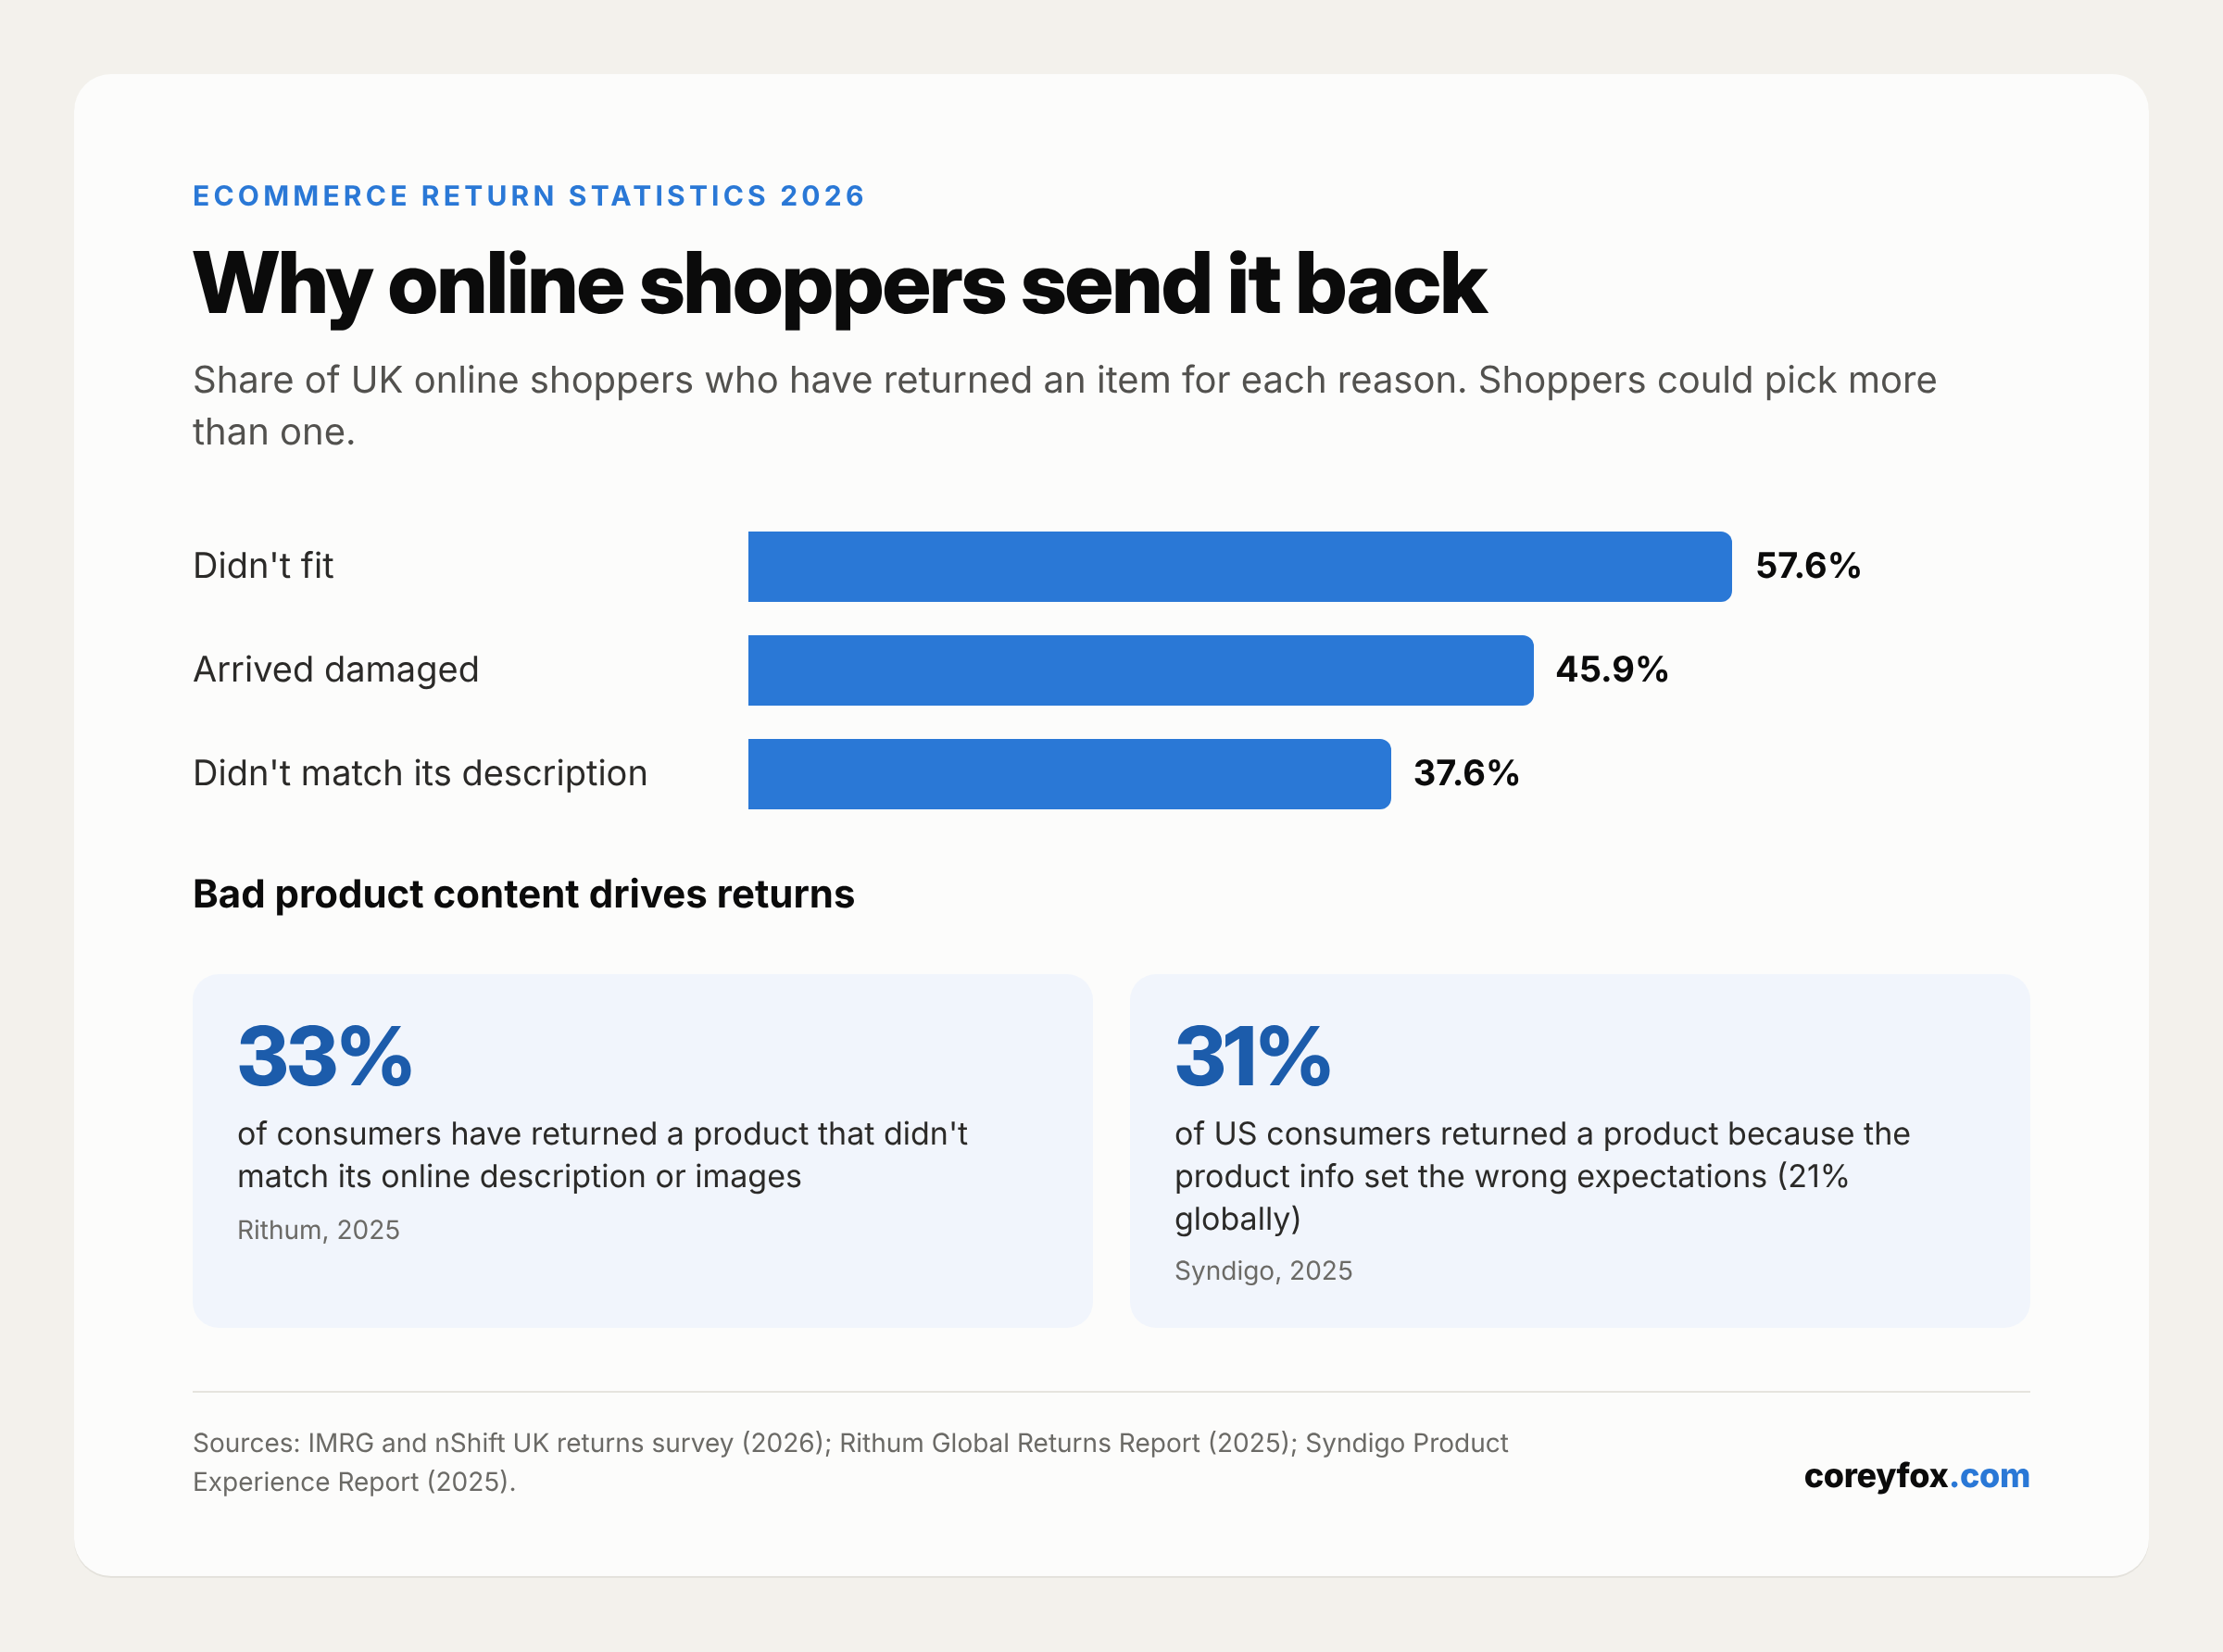
- 33% of consumers have returned products that didn’t match the online description or images (Rithum, 2025)
- 53% of apparel brands and retailers name size and fit as the top return reason, ahead of color (16%) and damage (10%) (Coresight Research, 2023)
- In a 2026 UK survey, 57.6% of shoppers had returned an item that didn’t fit, 45.9% an item that arrived damaged and 37.6% an item that didn’t match its description (IMRG and nShift, 2026)
- 31% of US consumers have returned a product because it didn’t meet expectations set by its online product information, versus 21% globally (Syndigo, 2025)
- “Significantly not as described” claims made up 48% of all 2025 returns in Signifyd’s network (Signifyd via Digital Commerce 360, 2026)
What a return costs the merchant
The refund is only part of it. Shipping, inspection, repackaging, markdowns and lost resale value come on top.
- Online returns cost US retailers an average of 21% of order value (Pitney Bowes, 2022)
- US apparel retailers spent an estimated $25.1 billion processing returns in 2023, not counting merchandise waste (Coresight Research, 2023)
- 40% of retailers that charge for returns cite higher processing costs, 40% cite higher carrier shipping costs and 33% cite economic uncertainty and tariff risk (NRF and Happy Returns, 2025)
- 64% of merchants say updating their returns process in the next six months is a priority (NRF and Happy Returns, 2025)
How return policies affect purchase decisions
Shoppers read the return policy before they buy, and a bad experience costs you the next order.
- 81% of consumers read return policies before buying (NRF and Happy Returns via UPS, 2025)
- 82% of consumers say free returns matter when shopping online, up from 76% in 2024 (NRF and Happy Returns, 2025)
- 88% of consumers expect free returns as standard (Rithum, 2025)
- 71% of consumers are less likely to shop with a retailer again after a poor returns experience, up from 67% in 2024 (NRF and Happy Returns, 2025)
- 47% of consumers have stopped shopping at a retailer because of an unfavorable return policy (Rithum, 2025)
- 73% of shoppers made an extra purchase after a positive return experience (Appriss Retail via Chain Store Age, 2026)
- 76% of shoppers are more likely to choose a return option with an instant refund or exchange (NRF and Happy Returns, 2025)
- 44% of leading ecommerce sites don’t display or link the return policy on the product page, even though 60% of shoppers look for it there (Baymard Institute, 2026)
- 26.3% of UK shoppers actively avoid retailers that charge for returns (IMRG and nShift, 2026)
Return fraud and abuse statistics
Retailers separate fraud (illegal: stolen goods, fake receipts, swapped items) from abuse (technically allowed but costly: wardrobing, serial bracketing). Abuse is the bigger number.
- 9% of all returns are fraudulent (NRF and Happy Returns, 2025)
- $100 billion (14.2%) of 2025 returns loss was preventable fraud and abuse (Appriss Retail, 2026)
- Returns abuse cost retailers $86 billion in 2025, 6x more than returns fraud (Appriss Retail, 2026)
- 15.14% of all 2024 returns were fraudulent, costing retailers $103 billion (Appriss Retail and Deloitte, 2024)
- 60% of retailers reported wardrobing (buying, using, then returning an item), 55% reported returns made with fraudulent or stolen tender and 48% reported returns of stolen merchandise (Appriss Retail and Deloitte, 2024)
- Among retailers that track fraud, 71% saw more overstated return quantities, 65% saw more empty-box (“box of rocks”) returns and 64% saw more decoy returns such as counterfeits (NRF and Happy Returns, 2025)
- 39% of Gen Z shoppers admit to returning a fraudulent decoy instead of the original item (NRF, 2026)
- Nearly 1 in 5 fraudulent orders come from organized networks, per Happy Returns data (NRF, 2026)
- Abusive returns coded as “damaged items” rose 158% year over year in 2025 (Signifyd via Digital Commerce 360, 2026)
- 28% of returns worth more than $800 contain fraud signals in Loop’s network (Loop Returns, 2025)
- 85% of retailers now use AI to detect or prevent return fraud (NRF and Happy Returns, 2025)
Ecommerce payment fraud and chargeback statistics
Returns are one leak. Payment fraud and disputes are the other, and they cost more than the face value of the transaction.
- US ecommerce and retail merchants incur $4.61 in costs for every $1 of fraud (LexisNexis Risk Solutions, 2025)
- 64% of ecommerce and retail fraud executives say fraud hurts conversion, and 63% say it increases customer churn (LexisNexis Risk Solutions, 2025)
- 41% of North American merchants still rely on manual processes to prevent fraud (LexisNexis Risk Solutions, 2025)
- Global chargeback costs are projected to rise from $33.79 billion in 2025 to $41.69 billion in 2028 (Mastercard, 2025)
- About 45% of merchant chargeback volume is fraudulent (first-party or third-party fraud) (Mastercard, 2025)
- The average chargeback is worth $110 in the US and $84 in retail (Mastercard, 2025)
- 26% of US consumers experienced payment fraud in the past year, and 73% have abandoned an online purchase over payment fraud concerns (Sift, 2026)
- Card testing attacks rose 65% between Q2 2024 and Q2 2025 (Signifyd, 2025)
Holiday return season
Holiday orders come back at a higher rate, and January is when fraud flags spike.
- Retailers expected 17% of 2025 holiday sales to be returned (NRF and Happy Returns, 2025)
- More than $181 billion of global online purchases made between Nov. 1 and Dec. 31, 2025 had already been returned, equal to 14% of purchases and up 10% year over year (Salesforce, 2026)
- About 1 in 7 US holiday returns were made in the last six days of December 2025 (Adobe via Digital Commerce 360, 2026)
- 18.3% of January 2026 returns were flagged as potentially fraudulent, up from 15.8% in the comparable December period (NoFraud via Digital Commerce 360, 2026)
- 49% of retailers planned to use third-party logistics partners to handle 2025 holiday returns, and 43% planned to hire seasonal returns staff (NRF and Happy Returns, 2025)
How better product information reduces returns
This is the part of the returns problem a brand controls before the order ships. Reviews, customer photos, size guides and accurate copy all show up in the data.
- 66% of shoppers are less likely to return a product if they can read ratings and reviews before buying (PowerReviews, 2023)
- 69% are less likely to return a product if they can see photos and videos from other customers (PowerReviews, 2023)
- 72% are less likely to return a product if they can read or ask questions in a product Q&A section (PowerReviews, 2023)
- 56% of shoppers have returned an item because it didn’t match its description (PowerReviews, 2023)
- 83% of desktop and 87% of mobile apparel sites fail to provide sufficient sizing information (Baymard Institute, 2022)
- 42% of users try to judge size from product images, yet 37% of sites don’t provide “in scale” images (Baymard Institute, 2026)
- 44% of shoppers have abandoned a purchase because of insufficient product information (Syndigo, 2025)
- 75% of consumers form a negative opinion of a brand after seeing incomplete or inaccurate product information, up from 62% in 2023 (Syndigo, 2025)
What this means for Shopify brands
I audit Shopify stores for a living, and the return reasons above line up with what I find on product pages. Most of the fixes are content and markup, not new apps.
- Treat fit info as conversion copy. With fit driving 56% of apparel and 61% of footwear returns, put measurements, model height and size worn, and a “runs small / true to size” note right by the size selector. A size chart buried in a modal or a PDF doesn’t count.
- Write descriptions that match the box. A third of shoppers have returned something that didn’t match its photos or copy. Material, real dimensions, weight, color under daylight and what’s included should be spelled out, and supplier copy should be checked against the actual product.
- Show customer photos and Q&A, then mark them up. Reviews, UGC photos and Q&A reduce return intent. Add Product, AggregateRating and Review schema so that information also shows up in Google and AI answers. If you’re unsure your theme and review app are outputting clean, non-conflicting schema, the Shopify Schema Kit covers it.
- Put the return policy on the product page. 60% of shoppers look for it there and 44% of sites don’t show it. A short line under the add-to-cart button, plus MerchantReturnPolicy markup, answers the question before it turns into a support ticket or an abandoned cart.
- Use return reasons as a content backlog. Export return reasons by SKU every month. The SKUs with the most “not as described” or “too small” returns are the product pages to rewrite first.
- Find the leaks before you guess. Run the free Shopify Revenue Leak Audit to see where product pages are missing the info that drives returns. If you want this handled monthly, that’s what my SEO/AEO retainer is for.
FAQ
What is the average ecommerce return rate?
About 19.3% of online sales were expected to be returned in 2025, according to NRF and Happy Returns. That compares with 15.8% for retail sales overall.
What product category has the highest return rate?
Apparel and its subcategories lead. Coresight Research measured a 24.4% online apparel return rate, and Loop’s merchant data shows swimwear (27%) and footwear (19%) above general apparel (17%).
What is the most common reason for online returns?
Poor fit. 61% of consumers say it’s their main reason for returning items (Rithum, 2025), followed by items arriving damaged and items that don’t match their description.
How much return fraud is there?
NRF and Happy Returns estimate 9% of all returns are fraudulent. Appriss Retail puts combined fraud and abuse at $100 billion, or 14.2% of returned merchandise in 2025.
How can ecommerce brands reduce returns?
Fix the product page first: detailed size and fit info, accurate descriptions, customer photos, reviews and Q&A. 66% of shoppers say reading reviews makes them less likely to return a product (PowerReviews).
Methodology and sources
Every statistic on this page was checked on the publisher’s own page or report, or on a trade publication reporting data the publisher gave it directly (marked “via”). Primary sources include the National Retail Federation and Happy Returns (UPS), Appriss Retail, Deloitte, Salesforce, Adobe, Signifyd, Loop Returns, Rithum, Coresight Research, Baymard Institute, PowerReviews, Syndigo, IMRG/nShift, ZigZag, LexisNexis Risk Solutions, Mastercard, Sift, NoFraud, Narvar and Pitney Bowes. Each stat carries the year it was published. Older figures (2022 and 2023) are included only where no newer primary figure exists, and are labeled. NRF and Appriss measure total returns differently, so their dollar totals shouldn’t be compared directly. Survey figures reflect what respondents reported, and vendor network data reflects that vendor’s merchants, not the whole market. Last updated October 2026.